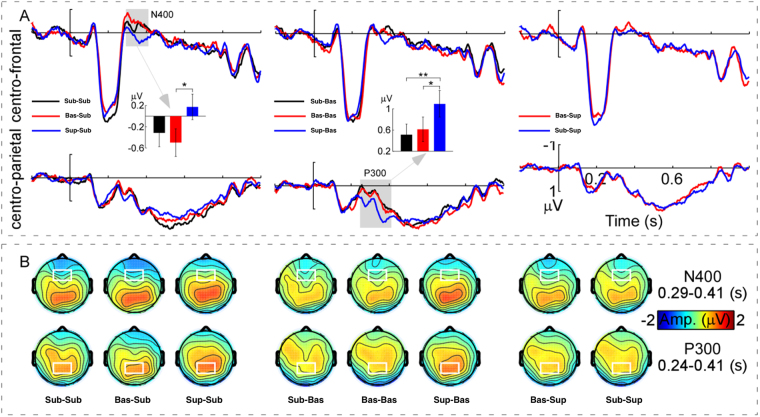
Figure 2.
Group-level average ERPs, mean amplitudes, and scalp topographies of N400 and P300 waves. Panel A (Top): The grand-average ERP waveforms measured at the centro-frontal region [(Fz + F1 + F2 + FCz + FC1 + FC2)/6] for the subordinate-subordinate, basic-subordinate, superordinate-subordinate, subordinate-basic, basic-basic, superordinate-basic, basic-superordinate, and subordinate-superordinate categorisations. Note that when the conclusion items were subordinate categorisations, N400 amplitudes were modulated by the categorisations of premise items (subordinate, basic, and superordinate) in the time window from 0.29–0.41 s (outlined by the grey rectangle). Panel A (Bottom): The grand-average ERP waveforms measured at the centro-parietal region [(CP1 + CPz + CP2 + P1 + Pz + P2)/6] for the eight trial types. It is notable that when the conclusion items belonged to basic level categorisations, P300 amplitudes were modulated by the categorisations of premise items (subordinate, basic, and superordinate) in the time window from 0.24–0.41 s (outlined by the grey rectangle). However, when the conclusion items belonged to superordinate categorisations, neither N400 nor P300 amplitudes were modulated by the categorisations of premise item (subordinate and basic). X-axis, time (s); Y-axis, amplitude (μV). The vertical bars indicate the onsets of conclusion items. The inlayed histograms intuitively show the N400 and P300 amplitudes as indicated by the grey arrows. Error bars indicate ± 1 standard error of the mean (SEMs). Note: *p < 0.05 and **p < 0.01, respectively, N = 19. Panel B shows the scalp topographies of N400 (averaged within 0.29–0.41 s) and P300 (averaged within 0.24–0.41 s) for the eight trial types, respectively. Noteworthy was that the scalp topographies of N400 and P300 displayed clear centro-frontal and centro-parietal distributions (marked in white) for all trial types, respectively. Note: ‘Amp’ is amplitude.

