Fig. 1.

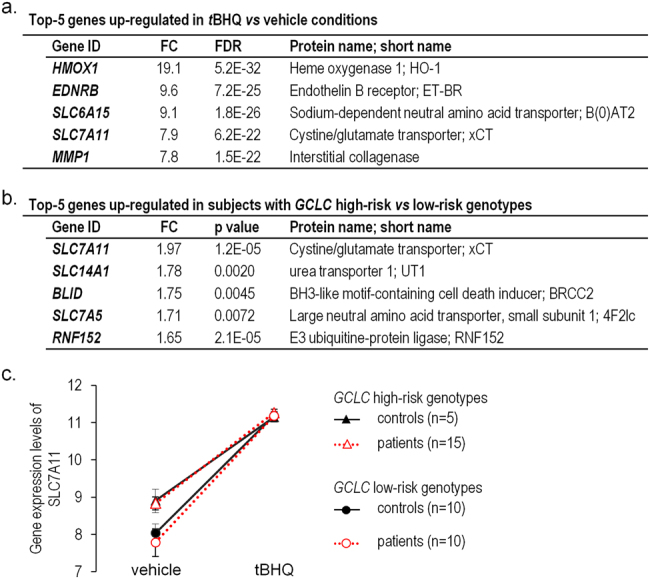
SLC7A11 expression in skin fibroblasts with GCLC high-risk or GCLC low-risk genotypes: Top-5 genes up-regulated in fibroblasts treated by tBHQ versus vehicle (a), and up-regulated in fibroblasts with GCLC high-risk versus GCLC low-risk genotypes (b) both in patients and controls. FC fold of change, FDR false discovery rate (paired comparisons). c Plot illustrating microarray data for SLC7A11. Data are represented as mean ± standard error of the mean
