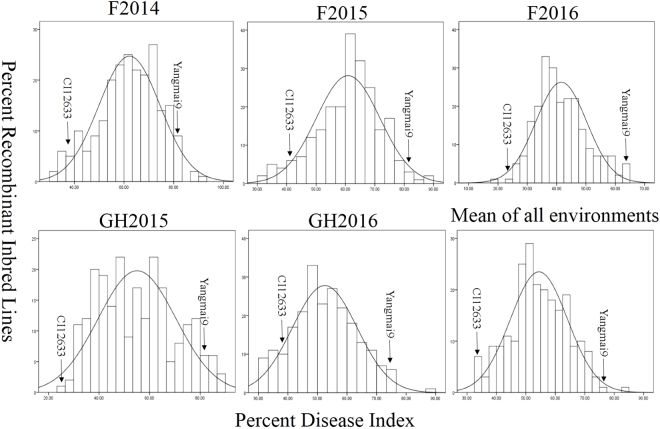
Figure 1.
Histograms showing frequency distribution pattern of sharp eyespot disease index (%) values in five environments. F2014, evaluated in field during the 2013–2014 cropping season; F2015, evaluated in field during the 2014–2015 cropping season; F2016, evaluated in field during the 2015–2016 cropping season; GH2015, evaluated in greenhouse during the 2014–2015 cropping season; GH2016, evaluated in greenhouse during the 2015–2016 cropping season; Mean of all environments, averaged data across five environments.

