Figure 7.
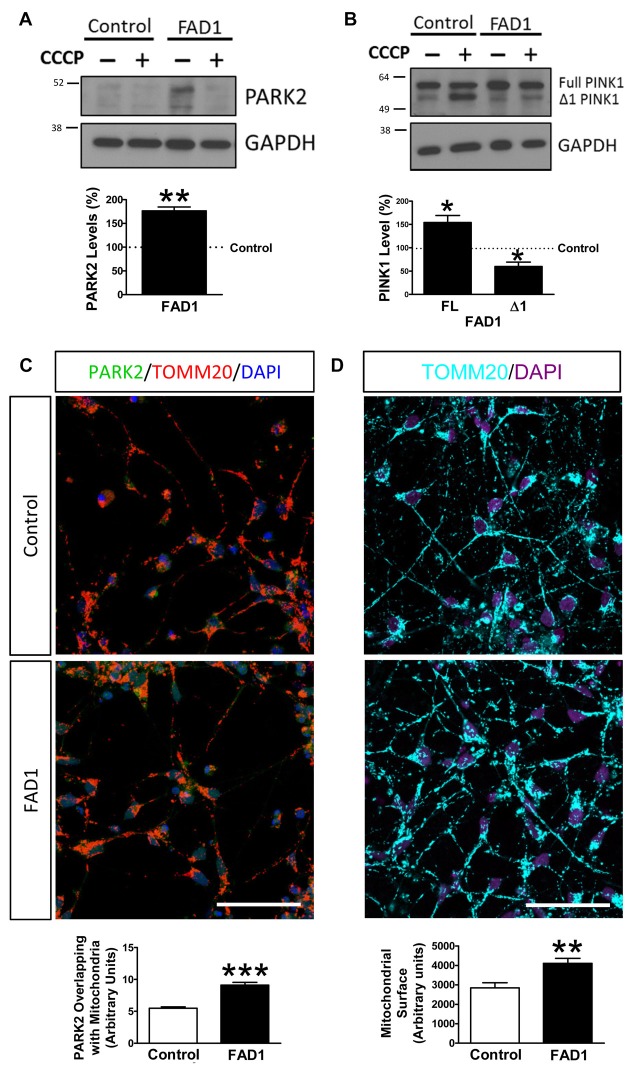
Mitophagy impairment in FAD1-derived neurons. (A) Representative Western blot of control and FAD1 neurons in the absence or presence of CCCP (20 μM) for 24 h and quantification of PARK2 levels under basal conditions. (B) Representative Western blot and quantification of FL-PINK1 and Δ1-PINK1 after the treatment with CCCP. (C) Representative confocal microscopy immunofluorescence images showing PARK2 in green, TOMM20 in red and DAPI in blue of control and FAD1 neurons treated with CCCP (20 μM) for 1 h. Quantification of the colocalization between PARK2 and TOMM20 expressed as area occupied by the overlapping elements per cell. (D) Representative confocal images of control and FAD1 neurons showing TOMM20 in cyan and DAPI in purple in basal conditions. Quantification of the mitochondrial surface per cell (n = 3 independent experiments using neurons derived from the control and AD iPSC lines 6842 A/7671 C, *p < 0.05; **p < 0.01; ***p < 0.001). Scale bar: 50 μm.

