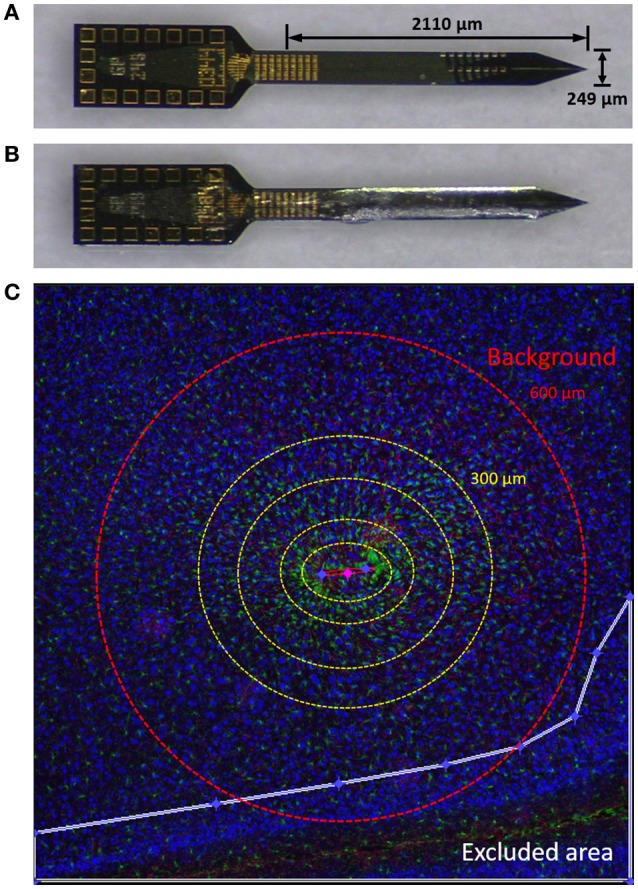
Figure 1.

Materials and methods. (A) Planar silicon probe GP_1x16_249 used in this study. (B) Probe dip-coated with PEG. (C) An image from a typical tissue slice demonstrating using Minute v1.5 for quantitative analysis of immunolabels. Yellow dotted concentric circles denote binned interval (0–50, 50–100, 100–200, and 200–300 μm from the defined probe contour). GFP (green), GFAP (red), and NeuN (blue) are shown. Outside the red dashed circle (600 μm) was considered background. The white line denotes the border of an exclusion area in this image. NeuN is pseudo-colored blue in this figure and yellow for subsequent figures.
