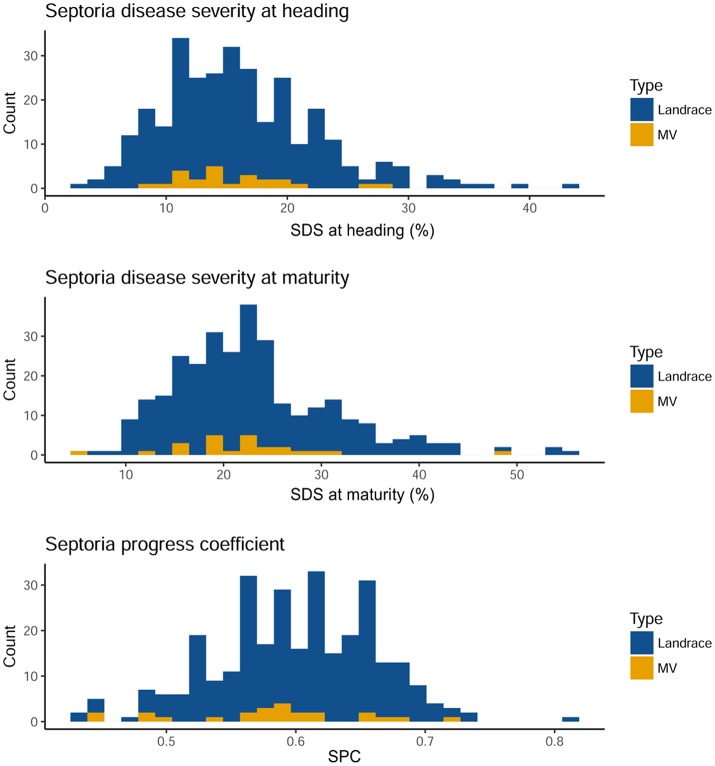
Figure 1.
Distribution of the disease traits combined over two consecutive years on landraces and modern varieties (MV). Higher affection classes are found toward the right end of the graphs. Septoria disease severity at heading and maturity follow a normal distribution. At maturity, the severity distribution is expectedly shifted to higher values. Septoria progress coefficient, a measure of disease severity normalized by plant height show a different distribution. On the x-axis, the BLUP value of the considered genotype. Colors according to legend.

