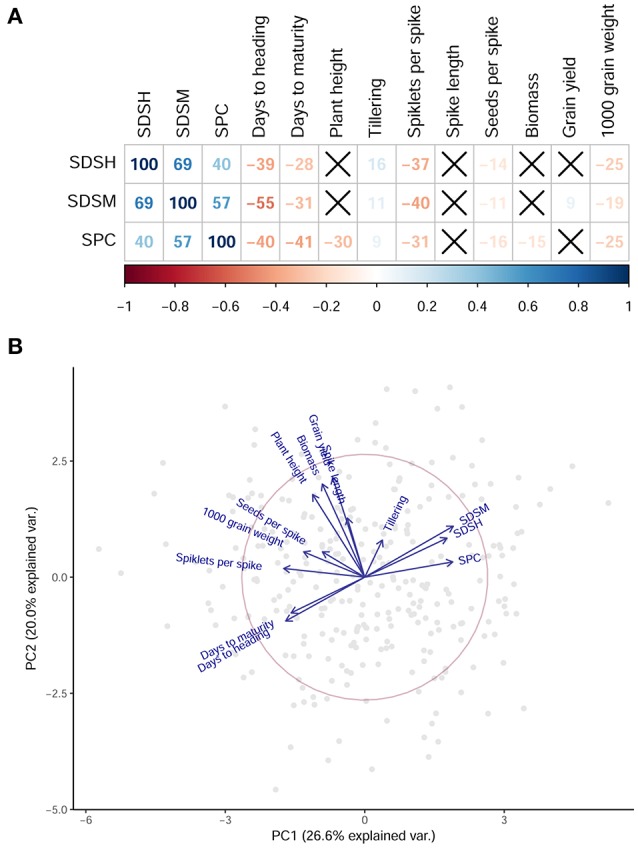
Figure 2.

Relationship among disease resistance traits and agronomic traits. (A) The results of a correlation analysis on disease traits and agronomic traits. For each pair of phenotypes, correlation coefficients are reported as percentages, and are colored with a shade representing the intensity of the correlation according to the color bar below. Crossed-out squares represent non-significant correlations. SDSH, Septoria disease severity at maturity; SDSM, Septoria disease severity at maturity; SPC, Septoria progress coefficient. (B) A biplot of the first two PC representing the phenotypic variance. Gray dots are samples. Blue arrows represent the phenotypes included in the PCA. Early flowering samples have lower disease affection.
