Figure 3.

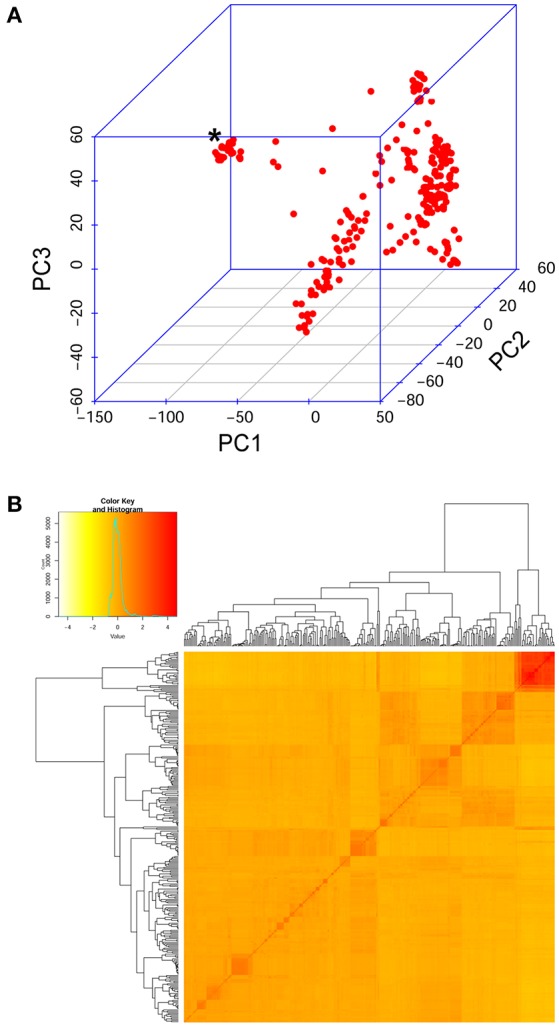
Genetic relatedness in the diversity panel evaluated on the SNP data also used for GWA. (A) Samples' relationship in the three-dimensional space of the first three principal components derived from a PCA. Red dots represent samples. An asterisk marks the group of modern varieties, which lay separated from Ethiopian landraces. (B) Kinship analysis on the panel. Top left, the distribution of estimated kinship values follows a normal distribution (turquoise curve). In the main panel, the pairwise kinship values depicted in increasing tones of red. Outside the matrix, the resulting clustering tree.
