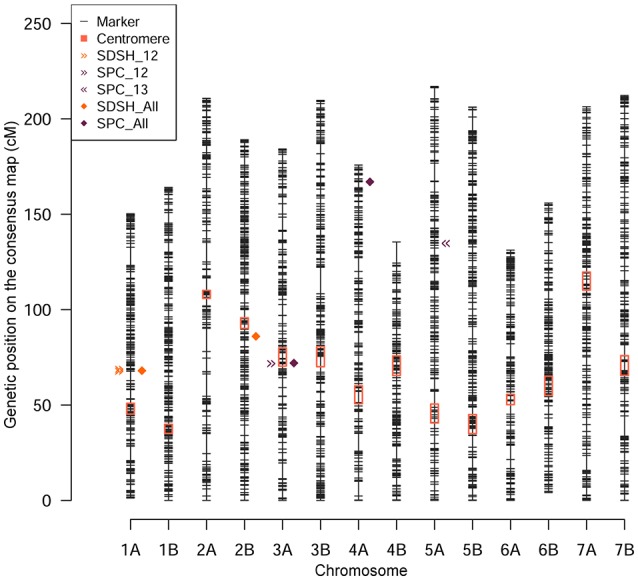
Figure 4.

Genomic position of the putative QTL identified for disease resistance. The SNP markers employed are depicted according to their genetic map position (y-axis). Pericentromeric regions are highlighted by red boxes. The genetic position of the putative QTL identified by MTAs are depicted by shapes and colors according to the legend top left.
