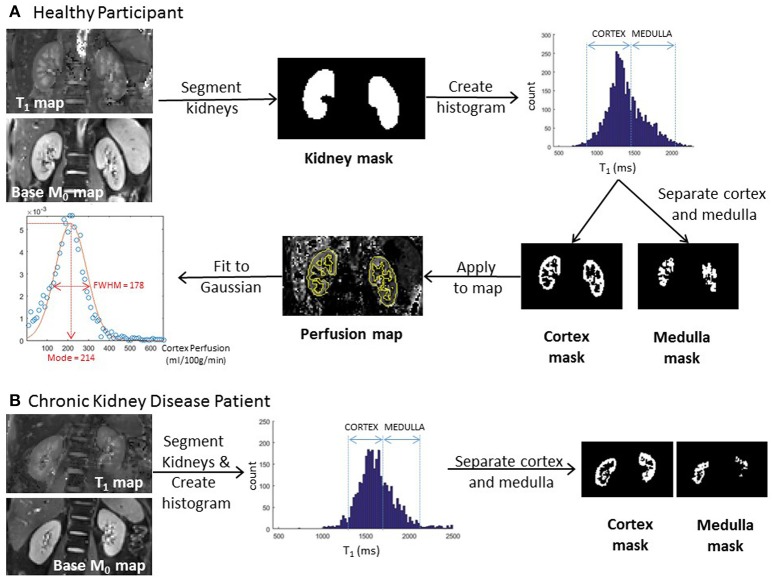
Figure 3.
(A) Example image analysis for a healthy participant indicating segmentation of the kidneys from the T1 map, definition of cortex and medulla masks from the histogram, and the application of the renal cortex mask to an arterial spin labeling perfusion map allowing the interrogation of a histogram [for mode and full-width-at-half-maximum (FWHM)] of renal cortex perfusion values. (B) Example image analysis for a chronic kidney disease patient indicating definition of cortex and medulla masks from the T1 histogram of the kidneys.

