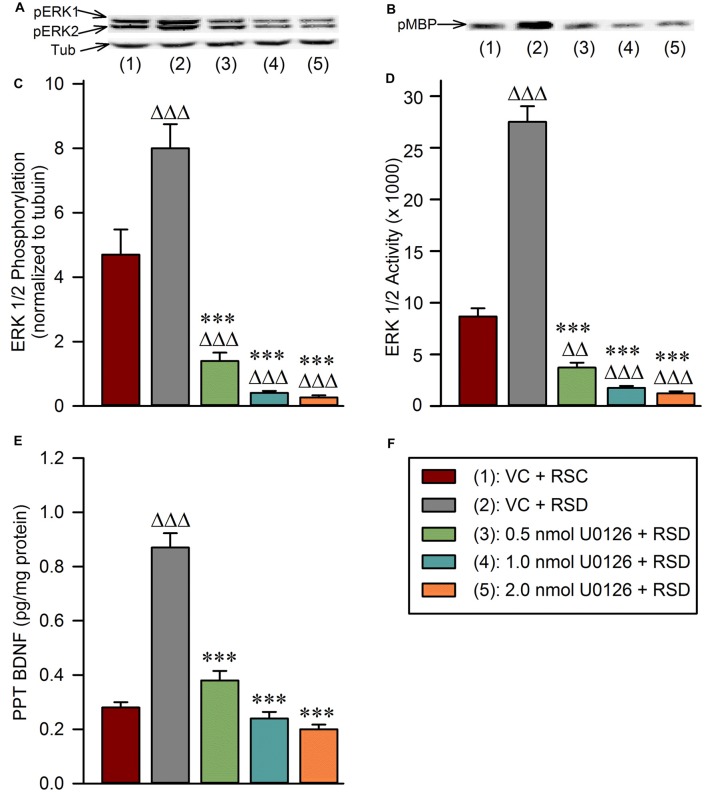
Figure 4.
Local application of U0126 into the PPT prevents selective REM sleep deprivation-induced increases in BDNF protein expression and extracellular-signal-regulated kinase 1 and 2 (ERK1/2) phosphorylation and activation in the PPT. (A) Representative western blots of pERK1/2 and α-tubulin in the PPT of animals in the following groups: (1) vehicle control injected unrestricted REM sleep (VC + RSC); (2) vehicle control injected selective REM sleep deprived (VC + RSD); (3) 0.5 nmol U0126 injected selective REM sleep deprived (0.5 nmol U0126 + RSD); (4) 1.0 nmol U0126 injected selective REM sleep deprived (1.0 nmol U0126 + RSD); and (5) 2.0 nmol U0126 injected selective REM sleep deprived (2.0 nmol U0126 + RSD). (B) Representative western blots of pMBP in the PPT of: (1) VC + RSC; (2) VC + RSD; (3) 0.5 nmol U0126 + RSD; (4) 1.0 nmol U0126 + RSD; and (5) 2.0 nmol U0126 + RSD. (C) Bars represent levels (mean ± SE) of phosphorylated ERK1/2 in the PPT of: (1) VC + RSC; (2) VC + RSD; (3) 0.5 nmol U0126 + RSD; (4) 1.0 nmol U0126 + RSD; and (5) 2.0 nmol U0126 + RSD. All analyses of pERK1/2 expression are normalized against α-tubulin. (D) Bars represent densitometric measurements (mean ± SE) from western blots of phosphorylated myelin basic protein (pMBP) levels in the PPT of: (1) VC + RSC; (2) VC + RSD; (3) 0.5 nmol U0126 + RSD; (4) 1.0 nmol U0126 + RSD; and (5) 2.0 nmol U0126 + RSD. (E) Bars represent amounts (mean ± SE) of BDNF in the PPT of: (1) VC + RSC; (2) VC + RSD; (3) 0.5 nmol U0126 + RSD; (4) 1.0 nmol U0126 + RSD; and (5) 2.0 nmol U0126 + RSD. (F) Key. Post hoc test (Bonferroni’s multiple comparisons test): triangle represents the comparison with vehicle control + REM sleep control (VC + RSC) and asterisk represents the comparison with vehicle control + selective REM sleep deprivation (VC + RSD). ∆∆∆ or ***p < 0.001.

