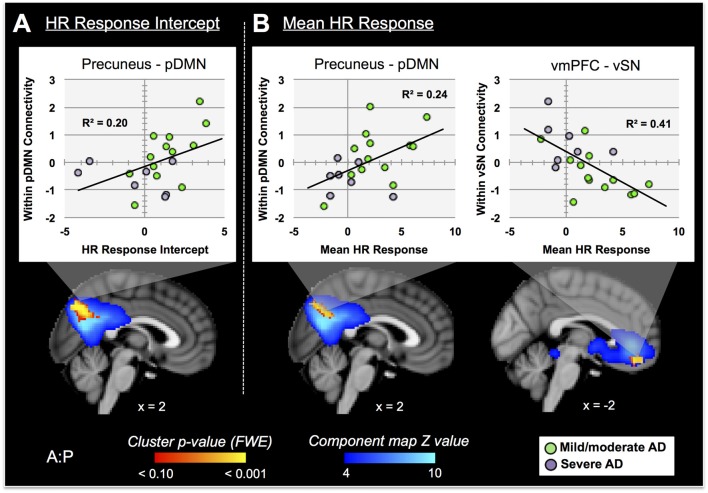
Figure 7.
RSN connectivity significantly correlated with HR response intercept and mean HR response within AD subjects. Associated ICs are presented in blue, clusters are red-yellow. Mean cluster beta-values, representing cluster–network connectivity strength for each subject, are plotted against HR responses (mild/moderate AD (mAD) green circles, sAD purple circles). (A) Top—plot of positive association between precuneus—posterior DMN component (pDMN, IC 1) and HR change intercept; bottom—visualization of the cluster. (B) Top—plots of positive and negative associations of precuneus–pDMN and vmPFC–ventral SN (vSN, IC 14) component, respectively, for mean HR change; bottom—visualization of clusters. Clusters visualized at p < 0.05, family-wise error (FWE). Coordinates are MNI space.

