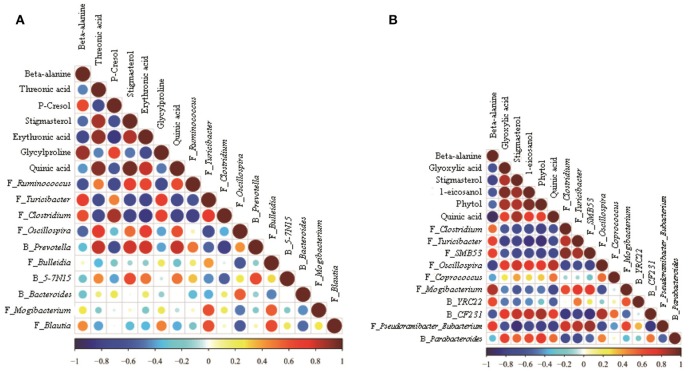
Figure 4.
Correlation matrix between the hindgut digesta microbiota (at the genera level; used in Figure 2) affected by the dietary treatment and the potential marker compounds (used in Table 2). Positive correlations are shown in red and negative correlations in blue. Color intensity and the size of the dots are proportional to the correlation values [rs] within a correlation group. (A) Colonic digesta, (B) Caecal digesta.

