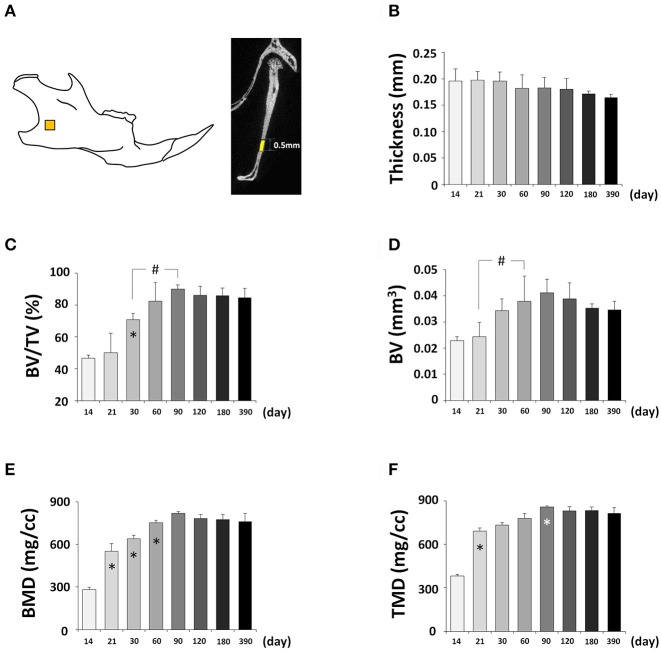
Figure 11.
μCT analysis of bone parameters of mandible. (A) Diagram of mandible at lateral view showing the measured area. (B–F) μCT analysis of bone parameters (thickness, bone volume/tissue volume[BV/TV], bone volume[BV], bone mineral density[BMD], and tissue mineral density[TMD], respectively) in mandible with age. *Represents significant change between indicated data point and immediate earlier time point; #Represents significant change between indicated data points (Tukey's multiple comparison test, p < 0.05).

