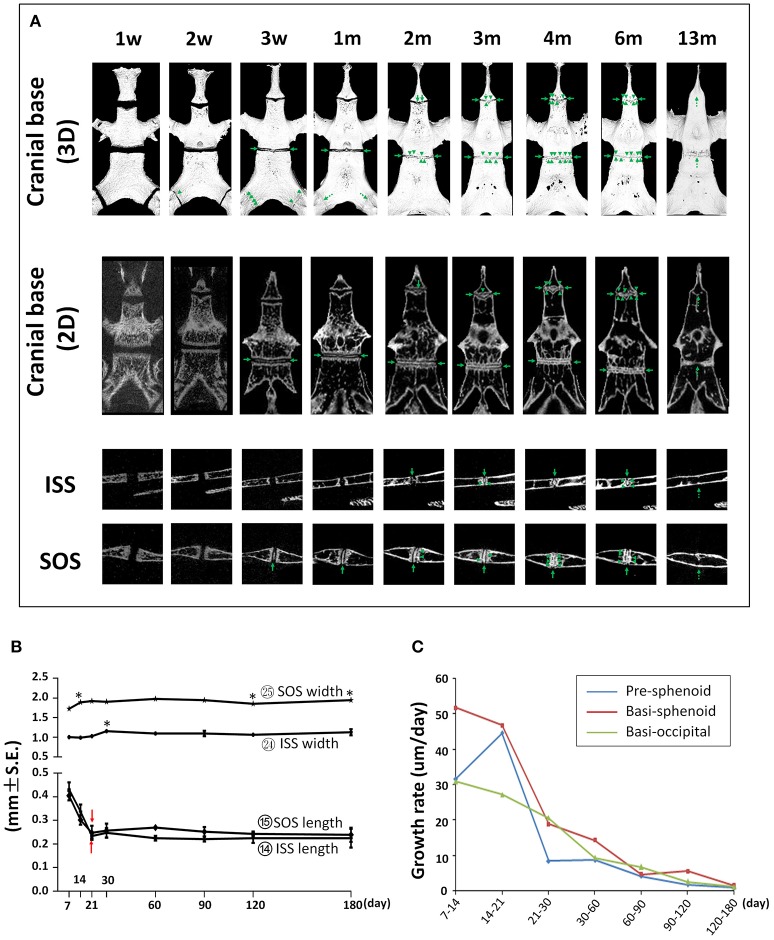
Figure 12.
Postnatal changes of synchondroses in cranial base. (A) Representative μCT images of synchondroses in the cranial base in 3-D reconstruction and 2-D sections. Green arrows point to the radiopaque areas; green arrow heads point to the bony bridges; dashed green arrows point to the completely fused synchondroses. (B) Linear measurement (length and width) of inter-sphenoid synchondrosis (ISS) and sphenoid-occipital synchondrosis (SOS). *Represents significant change between indicated data point and immediate earlier time point and red arrows indicate significant changes between all the neighboring time points before that time point (Tukey's multiple comparison test, p < 0.05). (C) Postnatal growth rate of pre-sphenoid, basi-sphenoid, and basi-occipital bone during the designated age intervals.

