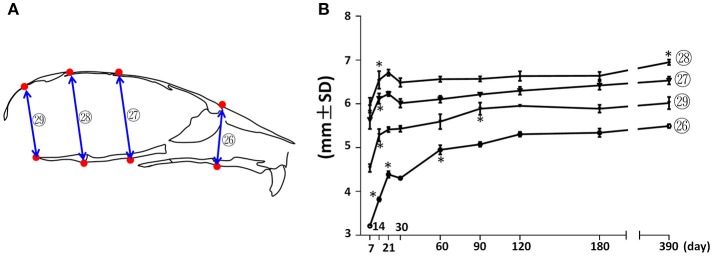
Figure 5.
Vertical growth of the mouse craniofacial skeleton. (A) Diagram of mouse skull at mid-sagittal plane with landmarks and parameters used for vertical dimension measurements. (B) Growth curves showing dynamic change of individual parameters on vertical dimension with age (landmarks and labels were described in Figure 1 and Table 1). *Represents significant change between indicated data point and immediate earlier time point (Tukey's multiple comparison test, p < 0.05).

