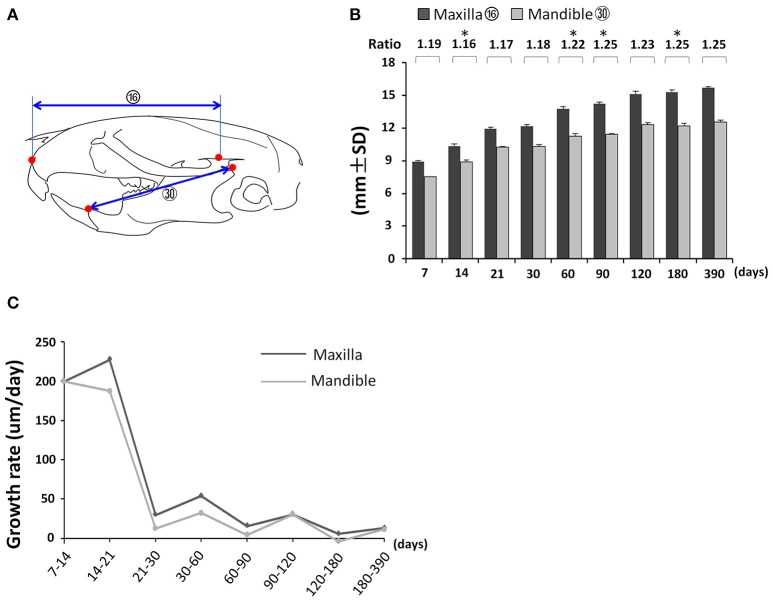
Figure 7.
Coordinated growth of the maxilla and mandible during postnatal development. (A) Diagram of lateral view of mouse skull with landmarks and parameters used for the measurement of maxilla and mandible. (B) Changes in length of maxilla and mandible with age and the ratio between them. (C) Growth rate of maxilla and mandible between each designated age intervals. *Represents significant change between indicated data point and immediate earlier time point (Tukey's multiple comparison test, p < 0.05).

