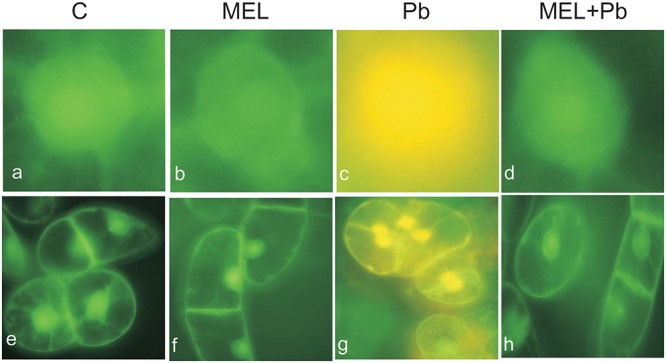
FIGURE 2.

Micrographs of living and dying BY-2 nuclei (a–d) and whole cells (e–h) detected by AO/EB staining. Green nuclei of living cells (a,b,d,e,f,h), yellow nuclei (c,g) of PCD-dying cells. C, BY-2 cells cultured on LS medium – the control variant; MEL, BY-2 cells cultured on LS medium with 200 nM melatonin added from the beginning of culture; Pb, BY-2 cells cultured on LS medium with 15 μM Pb2+ added on the 4th day of culture and MEL + Pb, BY-2 cells cultured on LS medium with melatonin added from the start of the culture and with Pb2+ added on the 4th day of culture. Micrographs were done 4 h after lead administration.
