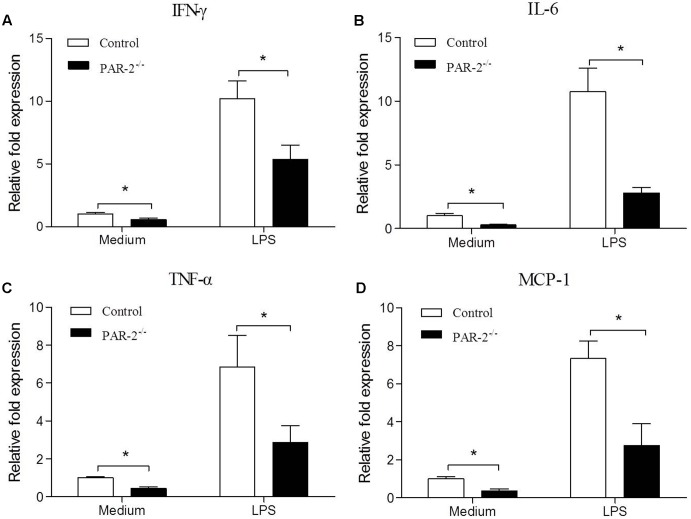
FIGURE 4.
Relative quantitative PCR assay for macrophage inflammatory responsiveness. Relative quantitative PCR analysis revealed that unstimulated and LPS-stimulated PAR-2-/- macrophage produced significantly lower levels of IFN-γ (A), IL-6 (B), TNF-α (C) and MCP-1 (D) compared with the control macrophage. Data represent relative fold of mRNA expression as compared to the control group. Data represent mean ± SD. ∗P < 0.05.

