Figure 10.

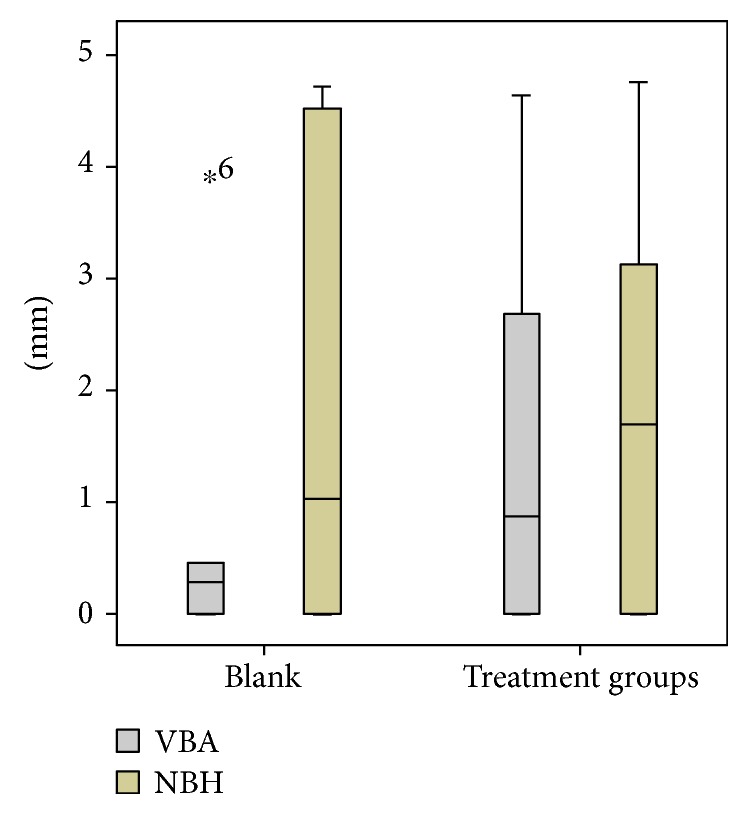
Boxplots comparing the vertical bone apposition (VBA; mm) and the new bone height (NBH; mm) in the blank versus all treatment groups. *No mean value calculated, only one case was evaluable.

Boxplots comparing the vertical bone apposition (VBA; mm) and the new bone height (NBH; mm) in the blank versus all treatment groups. *No mean value calculated, only one case was evaluable.