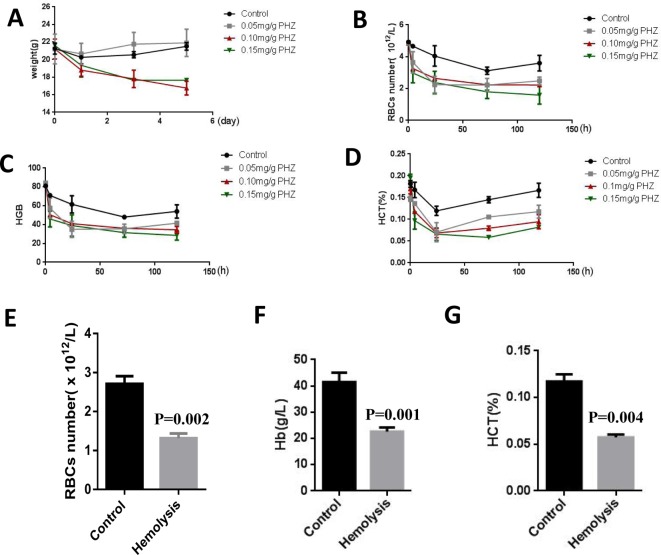
Figure 4. Murine anemia models were established by injection with PHZ.
(A) The weight of mice after injection different concentrations of PHZ. (B–D) The curves of RBCs number, Hb and Hct levels after injection with PHZ at different concentrations. (E–G) The comparisons of RBC number, Hb and Hct levels between control group and hemolysis group. The data were obtained from three independent experiments that included six mice per group.

