
Figure 5.
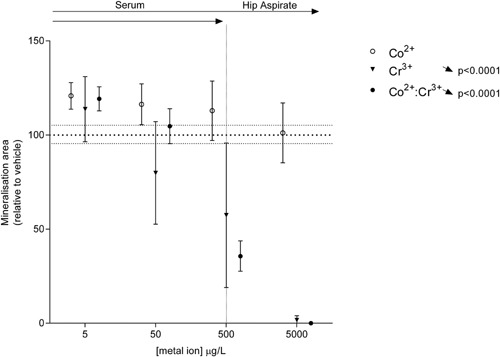
Metal ions reduce mineralization by late osteoblast/early osteocyte MLO‐A5 cells. Percentage area mineralized by MLO‐A5 cells following exposure to clinically relevant concentrations of Co2+ and Cr3+. All data are expressed as mean ± SD, relative to vehicle. Vertical dotted line separates the upper limit of previously reported ion concentrations equivalent to those in the patient serum and the hip aspirate. Significant linear trends across the concentration range analyzed using one‐way ANOVA are represented by arrows in the corresponding direction of effect and p‐values alongside the respective treatment condition.