
Figure 1.
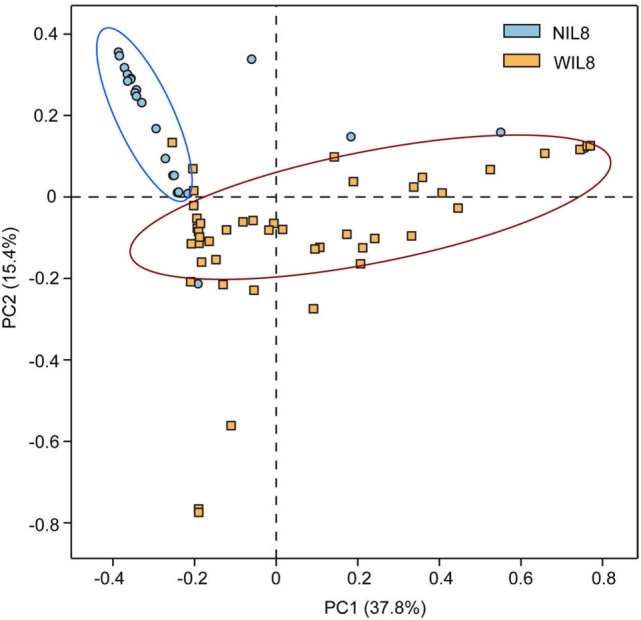
Principal coordinate analysis (PCoA) plot. PCoA plot of the urinary microbiota based on the unweighted UniFrac metric. Blue and yellow dots represent NIL8 and WIL8 specimens, respectively.
Official websites use .gov
A
.gov website belongs to an official
government organization in the United States.
Secure .gov websites use HTTPS
A lock (
) or https:// means you've safely
connected to the .gov website. Share sensitive
information only on official, secure websites.
Principal coordinate analysis (PCoA) plot. PCoA plot of the urinary microbiota based on the unweighted UniFrac metric. Blue and yellow dots represent NIL8 and WIL8 specimens, respectively.