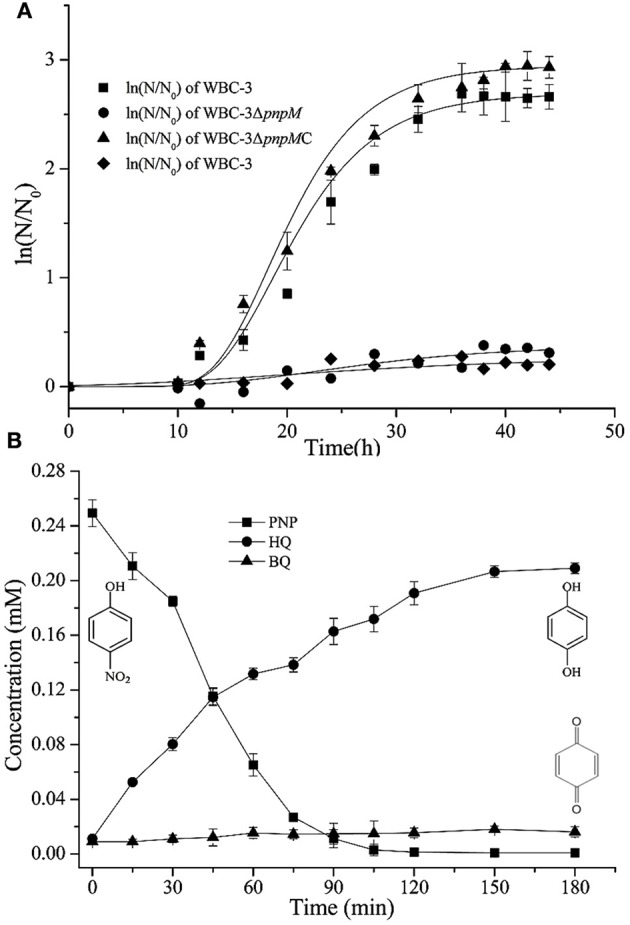
Figure 2.

(A) Growth curve of strains WBC-3, WBC-3ΔpnpM, and WBC-3ΔpnpMC. Three strains were grown at 30°C for 44 h in MM containing 0.3 mM PNP, and strain WBC-3 was also grown in MM containing 0.3 mM HQ. The curves were fitted by the modified Gompertz model with Origin software. The values are averages of three independent experiments. Error bars indicate standard deviations. N, number of cells; N0, initial number of cells. Square (■) stands for strain WBC-3. Circle (•) stands for strain WBC-3ΔpnpM. Triangle (▴) stands for strain WBC-3ΔpnpMC that the gene pnpM is complemented into the genome of strain WBC3-ΔpnpM. Diamond (♦) stands for strain WBC-3 grown on MM containing 0.3 mM HQ. (B) Time course of PNP degradation by strain WBC-3ΔpnpM in whole-cell biotransformation. Samples were withdrawn at the time points indicated and treated immediately as described in the text. The disappearance of PNP and the appearance of the products (BQ and HQ) were quantified by HPLC. The experiments were performed in triplicate, the results shown are average values of three independent experiments, and error bars indicate standard deviations.
