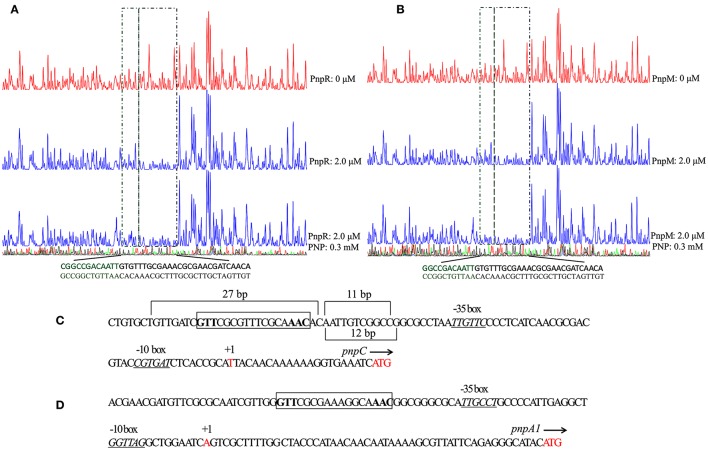
Figure 5.
The DNase I footprinting analysis of PnpR (A) or PnpM (B) binding to PpnpC with PNP or without PNP. An amount of 0.03 μM probe PpnpC covering the entire intergenic region of pnpC was incubated with 2.0 μM PnpM in the EMSA buffer with or without PNP (0.3 mM). The intergenic fragment was labeled with 6-carboxyfluorescein (FAM) dye, incubated with 2.0 μM PnpM (blue line) or without PnpM (red line). The region protected without PNP by PnpM from DNase I cleavage are indicated with a black dotted box. The extended protected region with PNP are indicated with a green dotted box. PnpR with PpnpC and PNP was treated in the same way of PnpM. The organizations of upstream regions of pnpCDEFG (C) and pnpA1M (D) operons. The putative -10 boxes and -35 boxes are underlined and in italics. Start codon ATG and TSSs are in red. TSSs are denoted by arrow and +1, and the direction of arrow stands for the direction of gene transcription. The putative regulatory binding sites (RBSs) GTT-N11-AAC are boxed. The promoter regions of pnpCDEFG protected from DNase I digestion by PnpM without and with PNP. The protected region is 27 bp by PnpM or PnpR without PNP. When PNP was present, a region of 11 bp of the protection region was increased by PnpM, while a region of 12 bp by PnpR.

