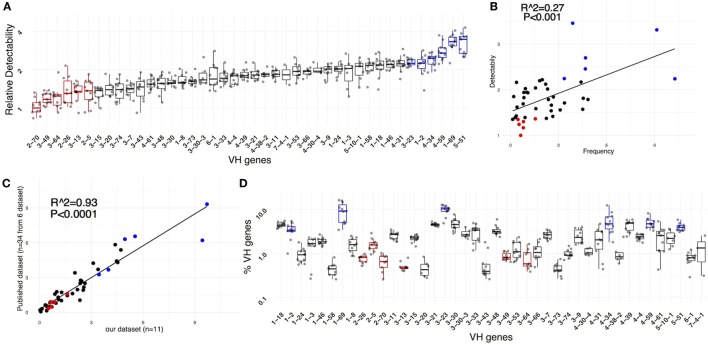
Figure 3.
IGHV gene-specific detectability. (A) Relative detectability for all genes. For ease of comparison, the efficiencies were scaled to set the minimal median efficiency (corresponding to IGHV2-70) to 1. (B) The IGHV gene-specific detectability positively correlates with the IGHV gene frequency observed in unique sequences derived from naïve peripheral blood B cells (R2 = 0.27, P < 0.001). (C) The average IGHV gene frequency observed in our dataset (n = 11) correlates with the average frequency observed in 34 samples from 6 different published datasets (R2 = 0.93, P < 0.0001). (D) IGHV gene frequencies and intra-sample variability.

