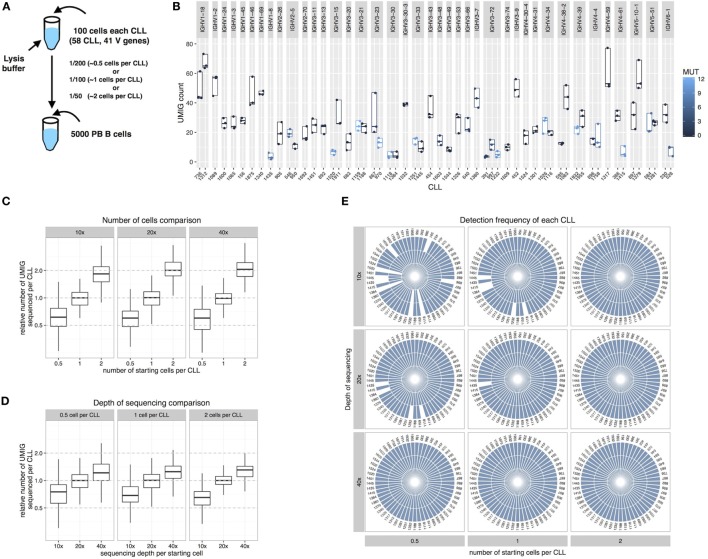
Figure 4.
Chronic lymphocytic leukemia (CLL) spike-in experiments. (A) A cell lysate containing 100 cells sorted from 58 different CLL samples was added to a lysate of 5,000 PBMCs derived from a normal person. The diluted material represents the equivalent of 0.5, 1, or 2 cells per CLL. (B) UMI group (UMIG) count across three replicates for every CLL and IGHV gene. (C) Relative UMIG count relative to input material. (D) Relative UMIG count relative to depth of sequencing. (E) Each slice in the pie charts represents a different CLL, and splice size indicates the frequency of detection among the three replicates. The depth of sequencing is calculated as a multiple of the number of starting cells for the library preparation.

