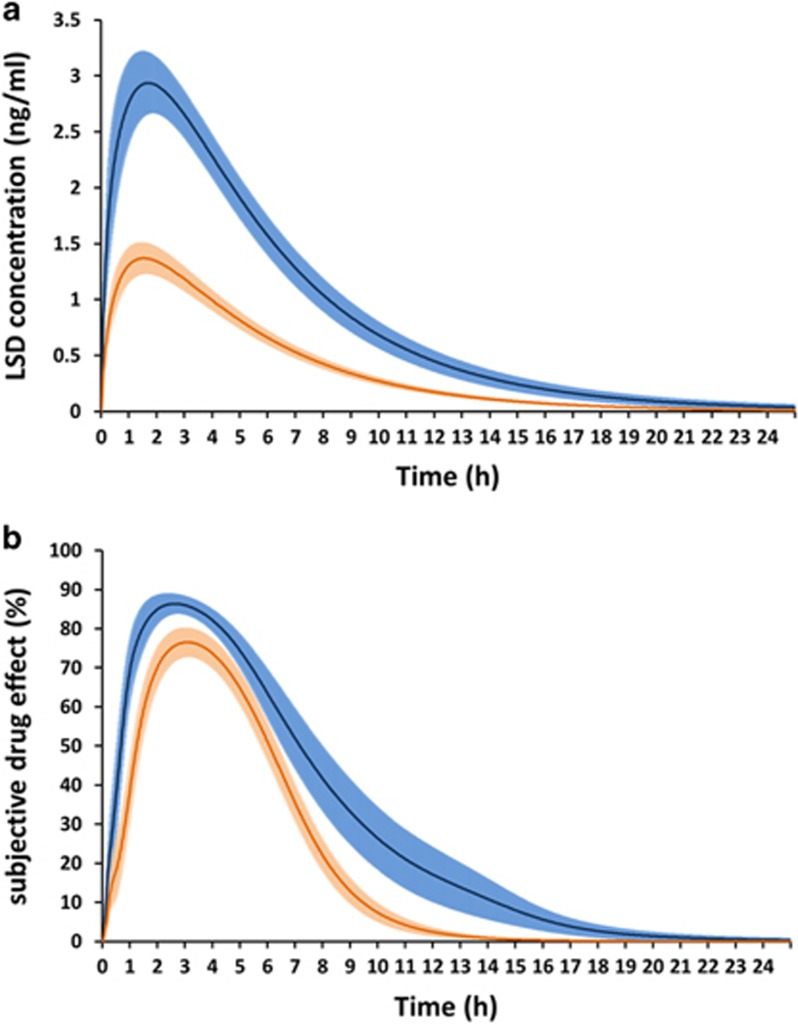
Figure 4.
Pharmacokinetics and pharmacodynamics of LSD. LSD concentration-time (a) and subjective effect-time (b) curves. LSD was administered at a dose of 100 and 200 μg p.o. to 24 and 16 healthy subjects, respectively, at the time point t=0. Subjective LSD effects (‘any subjective drug effects’) were assessed repeatedly using VASs (0–100%) along with blood samples to determine plasma concentrations of LSD (Dolder et al, 2015b; Dolder et al, 2016; Dolder et al, 2017). The LSD concentration curves (a) represent the mean±SEM of the individual curves fitted to the observed data using a 1-compartment model. The subjective drug effect curves (b) represent the mean±SEM of the individual curves fitted to the observed data using a sigmoidal Emax model linked to the predicted concentrations (Dolder et al, 2017).

