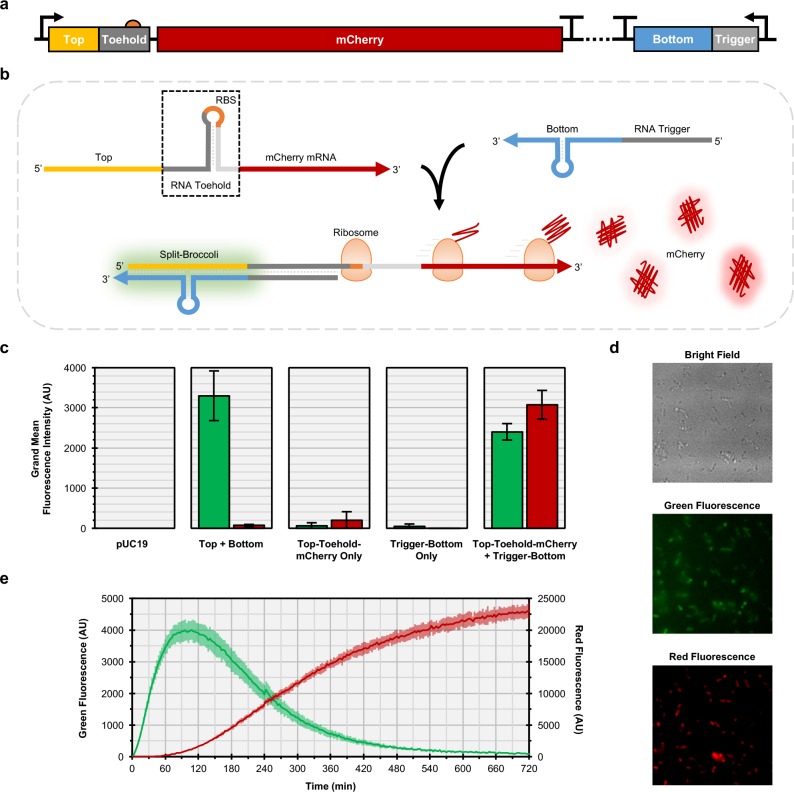
Figure 5.
Split-Broccoli is modular and can be used to monitor RNA–RNA hybridization events in vivo. (a) A Split-Broccoli Toehold Switch plasmid was constructed to include two constitutively expressed transcription units. The first transcription unit encodes Top (yellow) and Toehold (gray) sequences within the 5′ UTR of the mCherry mRNA (red). Translation of the Top-Toehold-mCherry mRNA is suppressed due to sequestration of the ribosome binding site (orange) and start codon within the toehold structure (boxed). The second transcription unit encodes Trigger (gray) and Bottom (blue) sequences, which can base pair with Top-Toehold-mCherry. (b) Hybridization of Top-Toehold-mCherry with Trigger-Bottom allows fluorescence activation of the Split-Broccoli system and translation of mCherry. (c) Green fluorescence (left columns) and red fluorescence (right columns) from flow cytometric analysis of populations show background levels of fluorescence for plasmids encoding a single transcription unit only (Top-Toehold-mCherry or Trigger-Bottom). Top + Bottom, which transcribes the Split-Broccoli system, exhibits only green fluorescence, while the Split-Broccoli Toehold Switch plasmid (Top-Toehold-mCherry + Trigger-Bottom) exhibits both red and green fluorescence, indicating both hybridization of Split-Broccoli and translation of mCherry. Grand mean fluorescence intensity (n = 4) is shown with error bars to indicate standard deviations. (d) Fluorescence microscopy imaging of E. coli harboring the Split-Broccoli Toehold Switch plasmid confirms hybridization of the Top and Bottom components of Split-Broccoli (green fluorescence) and activation of mCherry translation (red fluorescence). (e) An E. coli cell-free system (TX-TL) was used to monitor transcription and translation of the Split-Broccoli Toehold Switch plasmid and demonstrates the increased temporal sensitivity of Split-Broccoli (green fluorescence, left axis) over mCherry (red fluorescence, right axis). Mean values (n = 3) are shown with error bars to indicate standard deviations.

