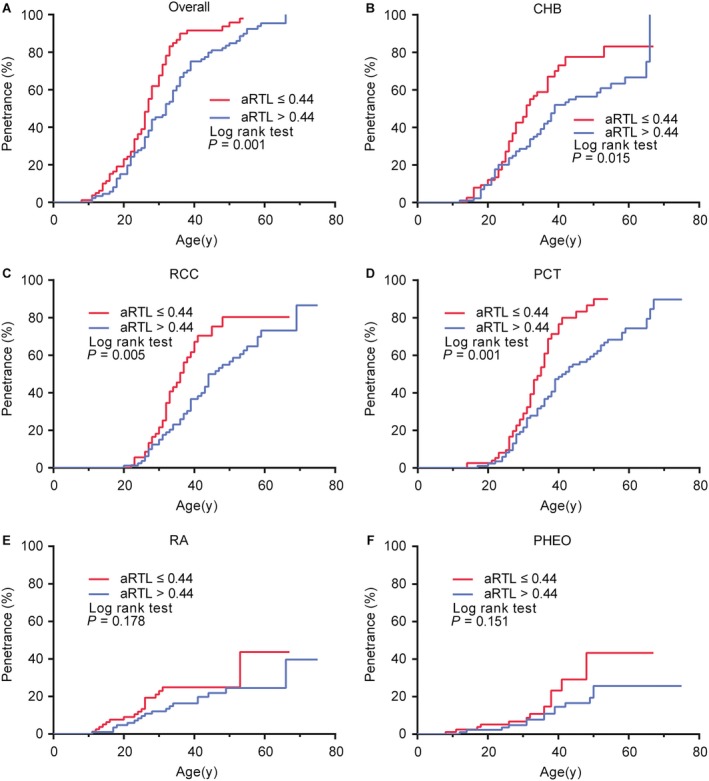
Figure 4.

Comparison of age‐related penetrance of VHL‐associated tumors in the shorter telomere group and the longer group. Kaplan–Meier plots describe the distribution of onset age of different tumor types. Log‐rank test was performed to compare the difference between shorter telomere group (red line) and longer telomere group (blue line) in the overall tumors(A), CHB(B), RCC(C), PCT(D), RA(E) and PHEO(F).
