
Figure 5.
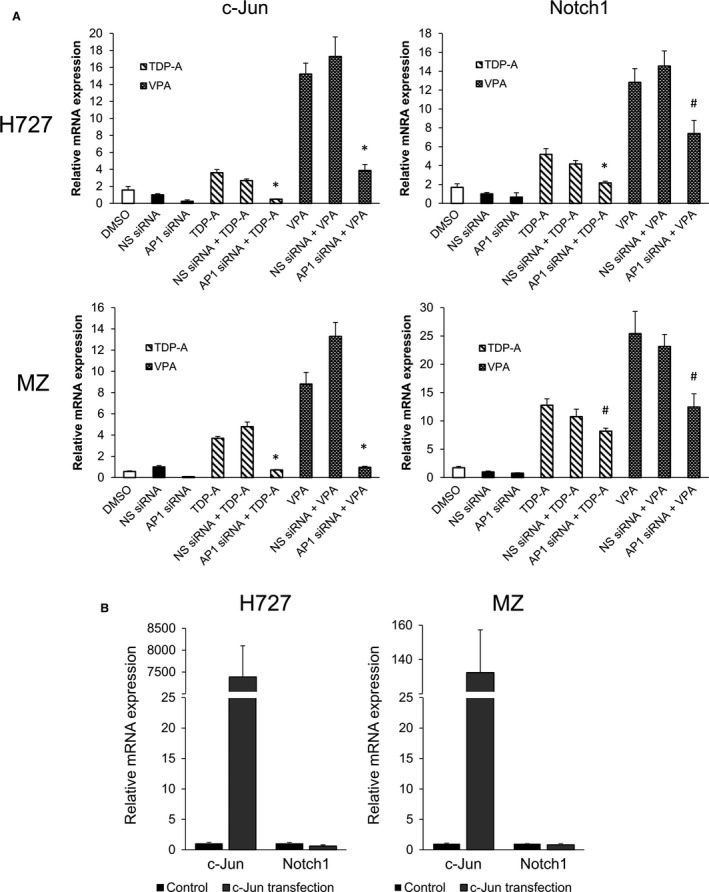
Effect of AP‐1/c‐Jun knockdown and overexpression on c‐Jun and Notch1 mRNA transcription. (A) H727 and MZ cells were transiently transfected with either c‐Jun or nonspecific (NS) control siRNA. Twenty‐four hours later, the cells were then treated with TDP‐A (10 nmol/L in H727, 5 nmol/L in MZ) and VPA (5 mmol/L in H727, 3 mmol/L in MZ) close to their IC 50 for 24 h. The data were plotted relative to the mRNA expression levels measured by RT‐PCR in cells treated with NS control siRNA. The mRNA expression of cells treated with DMSO only is also shown. Statistical significance was noted with (*P < 0.01) and (# P < 0.05) when compared against cells transfected with NS siRNA and subsequently treated with the HDAC inhibitors. (B) H727 and MZ cells were transiently transfected with plasmids containing the gene sequence of c‐Jun (DNA concentration: 10 μg). The data were plotted relative to the mRNA expression levels in cells treated with DMSO vehicle control. All values were presented as mean relative fold ± SEM.