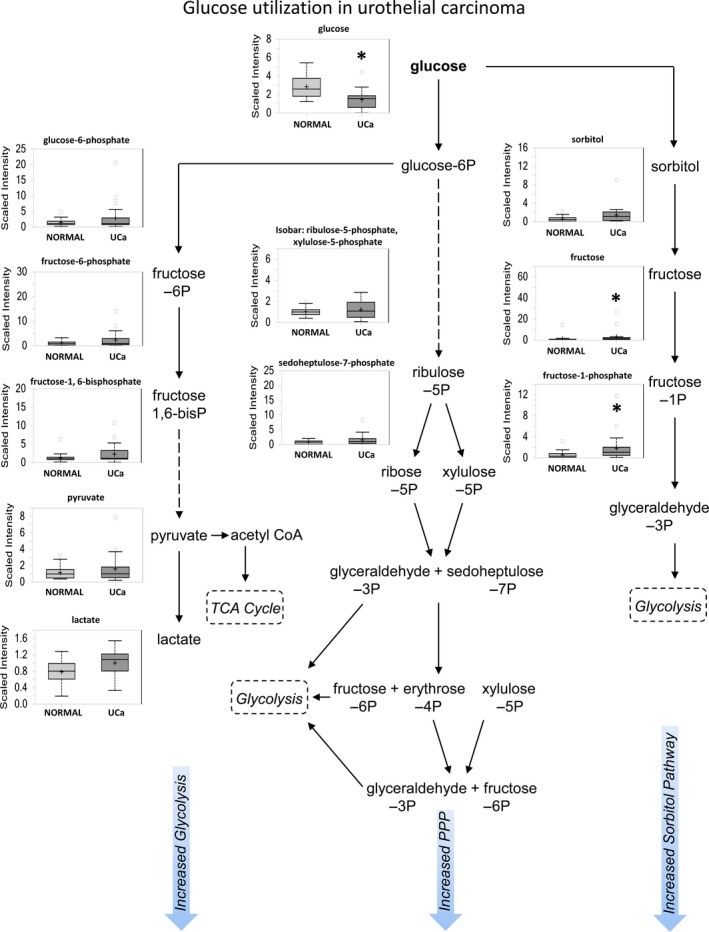
Figure 2.

Glucose metabolism shows an increase in glycolysis, sorbitol, and PPP pathway activity in urothelial carcinoma. Box plots show a comparison between histologically normal urothelium (NORMAL) and urothelial carcinoma (UCa) matched pairs. This schematic shows glucose utilization pathways that include glycolysis, PPP, and sorbitol pathways.
