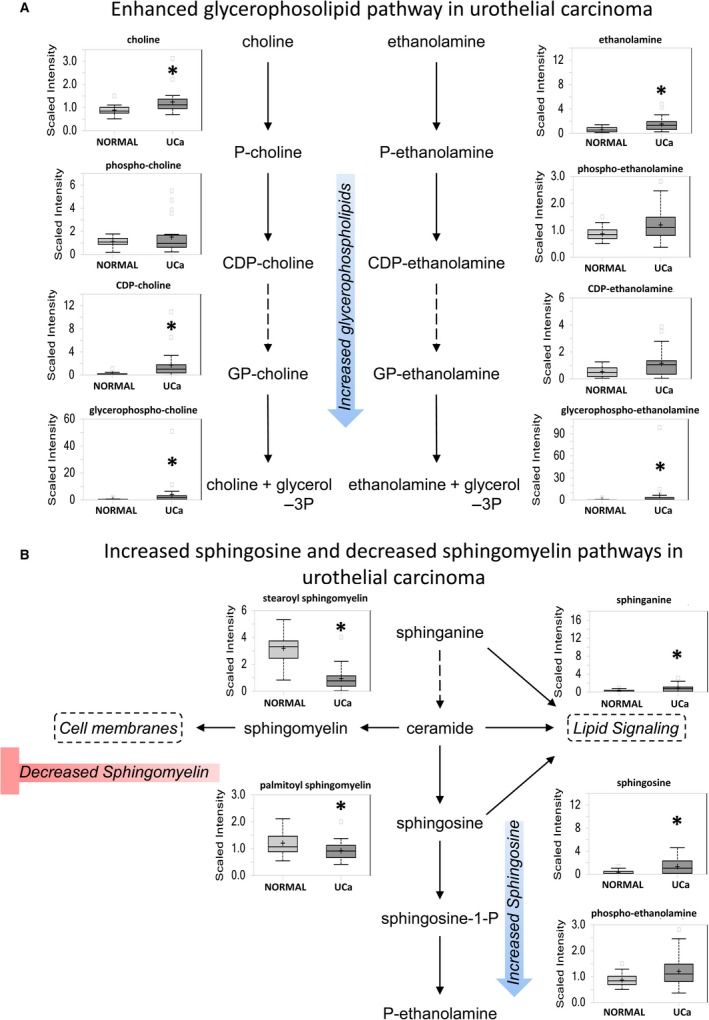
Figure 4.

Glycerophospholipid and sphingolipid pathways are shown as representatives of lipid metabolism pathways altered in urothelial carcinoma. (A) Most glycerophospholipids are elevated in UCa. (B) Sphingolipid metabolism shows increased sphingosine synthesis at the cost of sphingomyelin.
