. 2017 Apr 24;8(7):4858–4866. doi: 10.1039/c6sc05457a

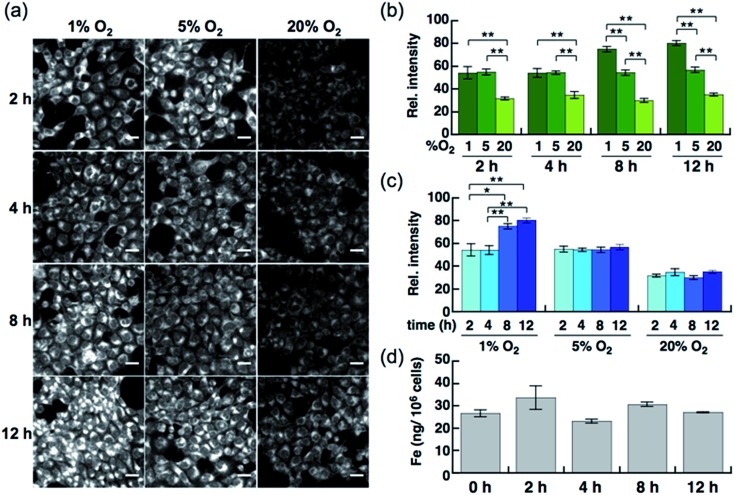
Fig. 5. (a) Confocal fluorescence microscopy images of HepG2 cells after incubation for 2 h, 4 h, 8 h, and 12 h under various oxygen concentrations (1%, 5%, and 20%). All the cells were stained with 5 μM SiRhoNox-1. Scale bars indicate 25 μm. (b) Quantification and evaluation of fluorescence signals at each oxygen concentration (1% O2, 5% O2, and 20% O2) at each time point. (c) Quantification and evaluation of time-dependency (2, 4, 8, and 12 h) at each oxygen concentration. Statistical analyses were performed with a Student's t-test. **P < 0.01, *P < 0.05 (n = 4). Error bars indicate ± S.E.M. (d) Measurement of total iron contents of the cells (per 106 cells) incubated under 1% O2 by atomic absorption. No significant increase was observed (n = 3).

Fig. 5