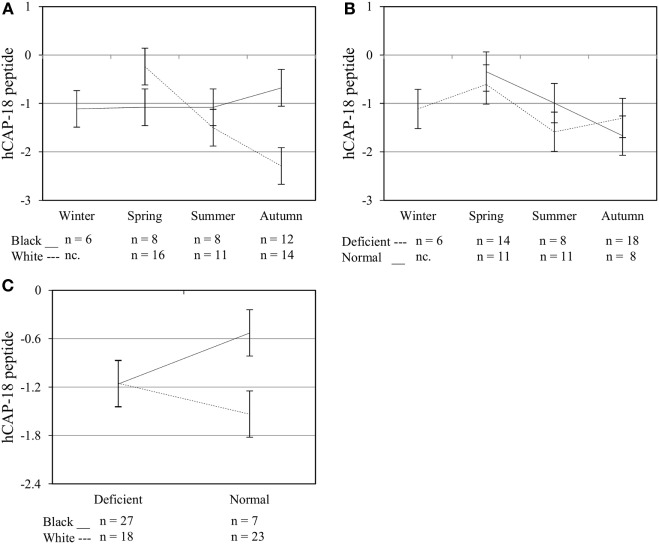
Figure 6.
Interaction between season, race, and 25(OH)D3 status influence intracellular hCAP-18 peptide level. The line graphs show the interaction effects for hCAP-18 peptide level, quantified by flow cytometry, in monocytes/macrophages from healthy Black (n = 34) and White (n = 41) South Africans. Season and race [(A), P < 0.001], season, and 25(OH)D3 status [(B), P < 0.010], and race and 25(OH)D3 status [(C), P < 0.001] interacted significantly to influence hCAP-18 levels. Error bars show the least significant difference at P < 0.050. nc. = not collected.

