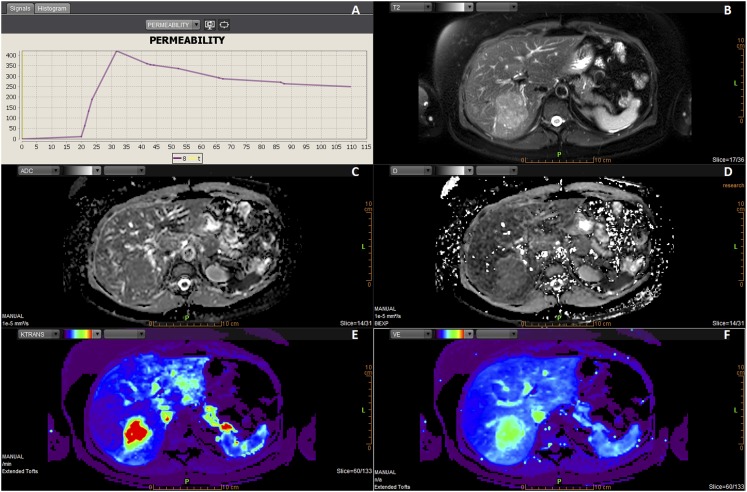
Figure 1.
Example of the layout in Olea (Olea Medical SA, La Ciotat, France) in the last step (“analysis”) of the dedicated workflow in a patient with focal nodular hyperplasia (FNH). The layout is divided into six smaller screens (a–f). T2 weighted images in the right upper corner are used for anatomical correlation and show the lesion within the right liver lobe (b). The parametric maps of apparent diffusion coefficient and “true diffusion” D reflect the degree of diffusion restriction, ranging from dark areas of restricted diffusion to white areas of nearly free diffusion (c, d). Colour parametric maps of Ktrans and Ve can be adjusted so that they easily display the lesion (e, f). After drawing a ROI (on a different slice, not shown) in the lesion in one of the parametric maps, a time–intensity curve appears in the left upper corner (a). This FNH showed to have a Type 1 curve.

