Figure 1.

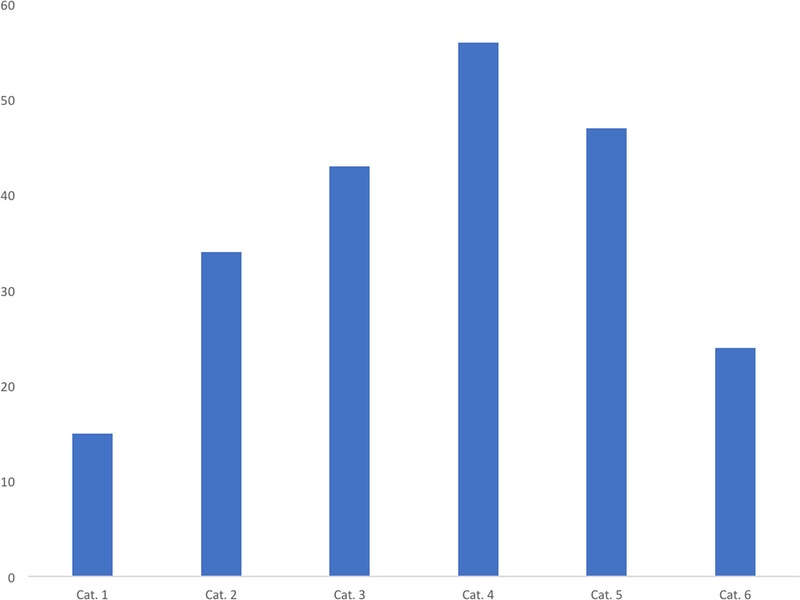
How the potency categories are populated. This figure combines the information from the first publication11 with the present data to show the number of substances placed into each of the 6 categories.

How the potency categories are populated. This figure combines the information from the first publication11 with the present data to show the number of substances placed into each of the 6 categories.