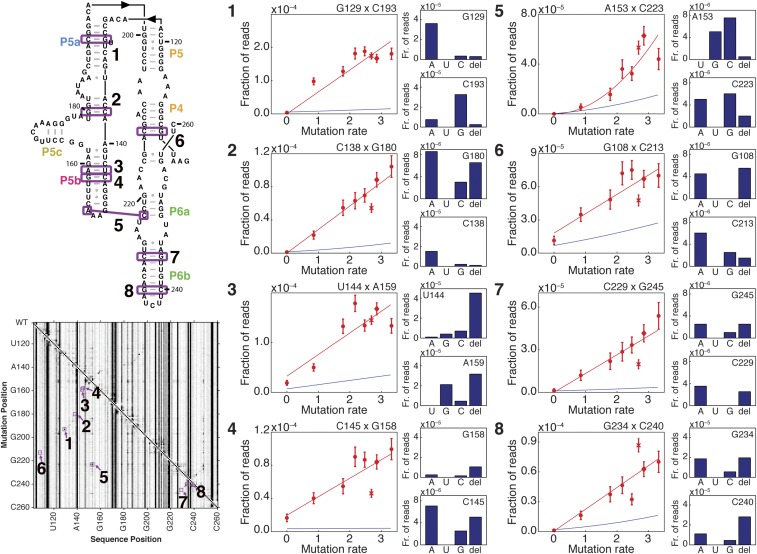
Fig. S7.
Titration of DMS dose to discriminate one-hit vs. two-hit mechanisms. Pairs of residues analyzed are annotated in purple on P4–P6 secondary structure and M2-seq dataset. For each pair of residues (1–8), the plot at the Left shows the following: (i) a scatter plot of the fraction of reads with a mutation at both positions at each DMS modification rate (red circles, with replicates of standard DMS modification condition shown as X and diamond), (ii) a fit to these points (red line), and (iii) the product of linear fits to the fraction of reads with a mutation at each member of the residue pair (blue line). The bar plots at Right show the fraction of reads with a mutation at both positions that display each type of mutation from the native residue, for the dataset shown in Fig. 2D.

