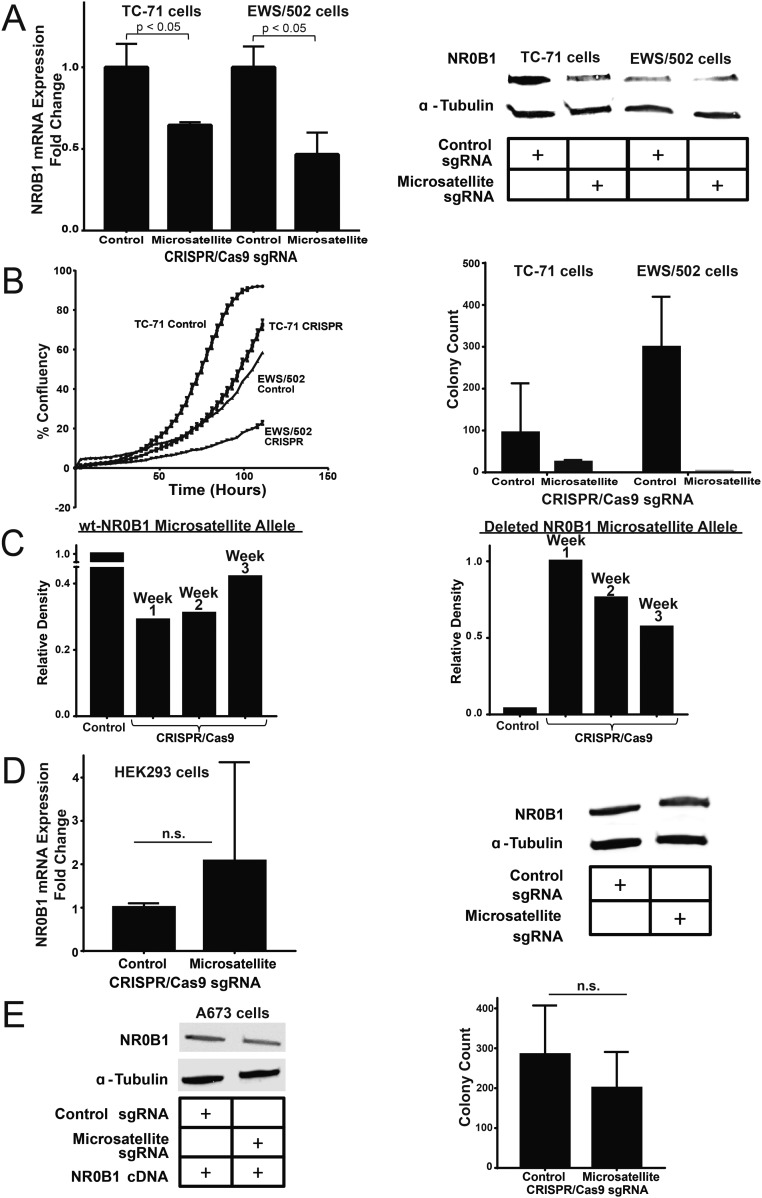
Fig. S2.
Deletion of the NR0B1 microsatellite in other cell lines. (A) NR0B1 mRNA and protein expression levels in control and CRISPR/Cas9-mediated knockout of the NR0B1 microsatellite in TC-71 and EWS/502 Ewing sarcoma cells (P < 0.05). Data are represented as mean ± SEM (n = 3). (B) Growth curves and soft agar assay quantification for NR0B1 microsatellite deletion in two other Ewing sarcoma cell lines (TC-71 cells and EWS/502 cells). Growth curve data are represented as mean ± SEM (n = 4). Control vs. CRISPR for TC-71 and EWS/502 cells are each statistically significant (P < 0.05). Soft agar data are represented as mean ± SEM (n = 2). (C) Densitometry quantification of PCR-amplified NR0B1-microsatellite–containing region for A673 control (wild-type NR0B1-microsatellite) allele vs. CRISPR-Cas9 knockout (deleted NR0B1-microsatellite) allele at different time points for up to 3 wk postlentiviral infection. (D) NR0B1 mRNA and protein expression levels in control and CRISPR/Cas9-mediated knockout of the NR0B1 microsatellite in non-Ewing sarcoma HEK293 cells. Data are represented as mean ± SEM (n = 3). n.s., not statistically significant. (E) NR0B1 protein levels and colony formation assay quantification for A673 cells with NR0B1 cDNA rescue in CRISPR/Cas9 control vs. microsatellite knockout. n.s., not statistically significant. Data are represented as mean ± SEM (n = 2).

