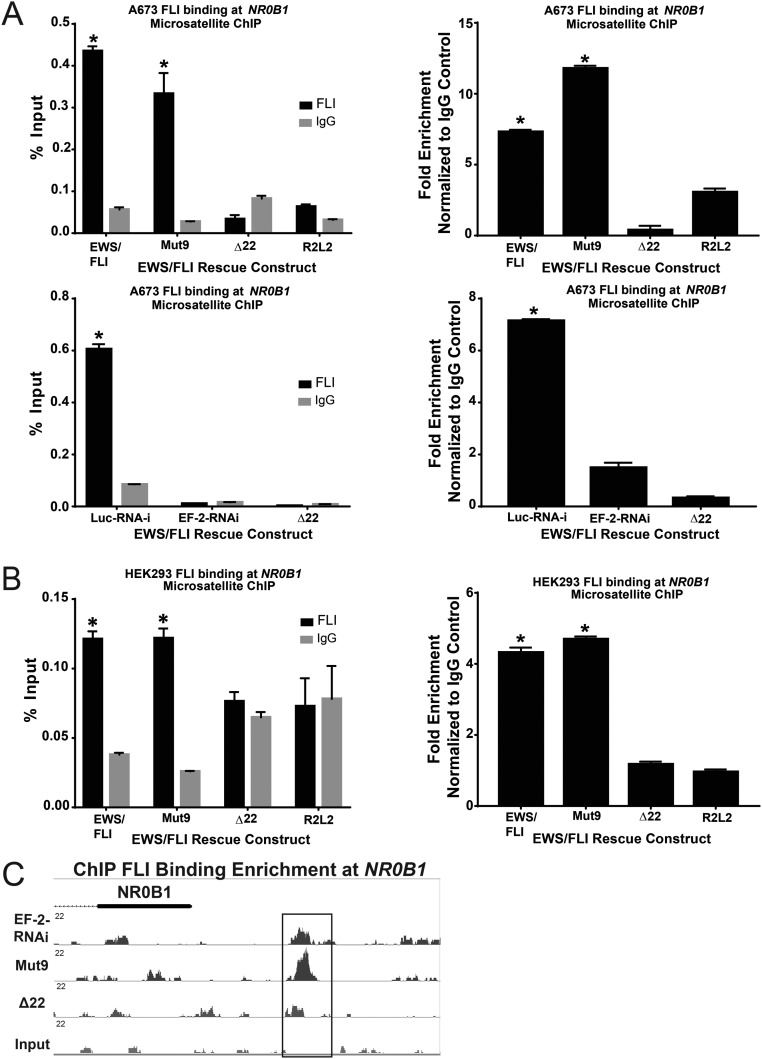
Fig. S6.
Mut9 and Δ22 binding at NR0B1 microsatellite. qPCR shows binding enrichment expressed as percent input and fold-change normalized to IgG mock control at the NR0B1 microsatellite following ChIP using an antibody against FLI vs. IgG in (A) A673 cells with control (Luc-RNAi) or EWS/FLI knockdown (“iEF-2–RNAi”) rescued with the indicated EWS/FLI mutant constructs or empty vector (“EF-2–RNAi”) and (B) non-Ewing sarcoma HEK 293 EBNA cells infected with mutant EWS/FLI constructs. Data are represented as mean ± SEM (n = 3). Asterisks denote statistical significance (P < 0.05) as assessed by paired two-tailed t tests, between EWS/FLI wild-type, Mut9, and Luc-RNAi vs. iEF-2-RNAi, Δ22, and R2L2, respectively. (C) A representative example from ChIP-seq data, showing FLI binding enrichment at the NR0B1 microsatellite in EWS/FLI-depleted cells and A673 cells rescued with empty vector, Mut9, or Δ22.

