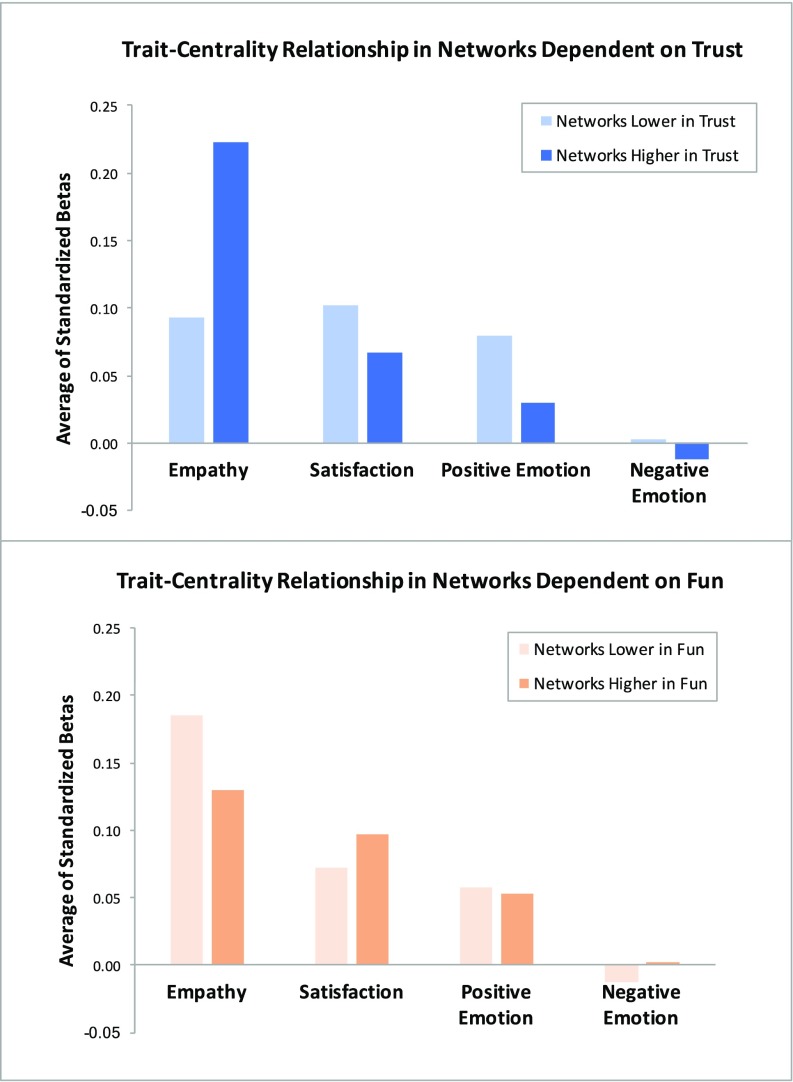
Fig. 2.
(Top) The strength of the relationship between each trait and indegree (as indexed by the average standardized betas from Table 1) for networks that were considered higher vs. lower in trust. (Bottom) The strength of the relationship between each trait and indegree for networks that were considered higher vs. lower in fun and excitement.

