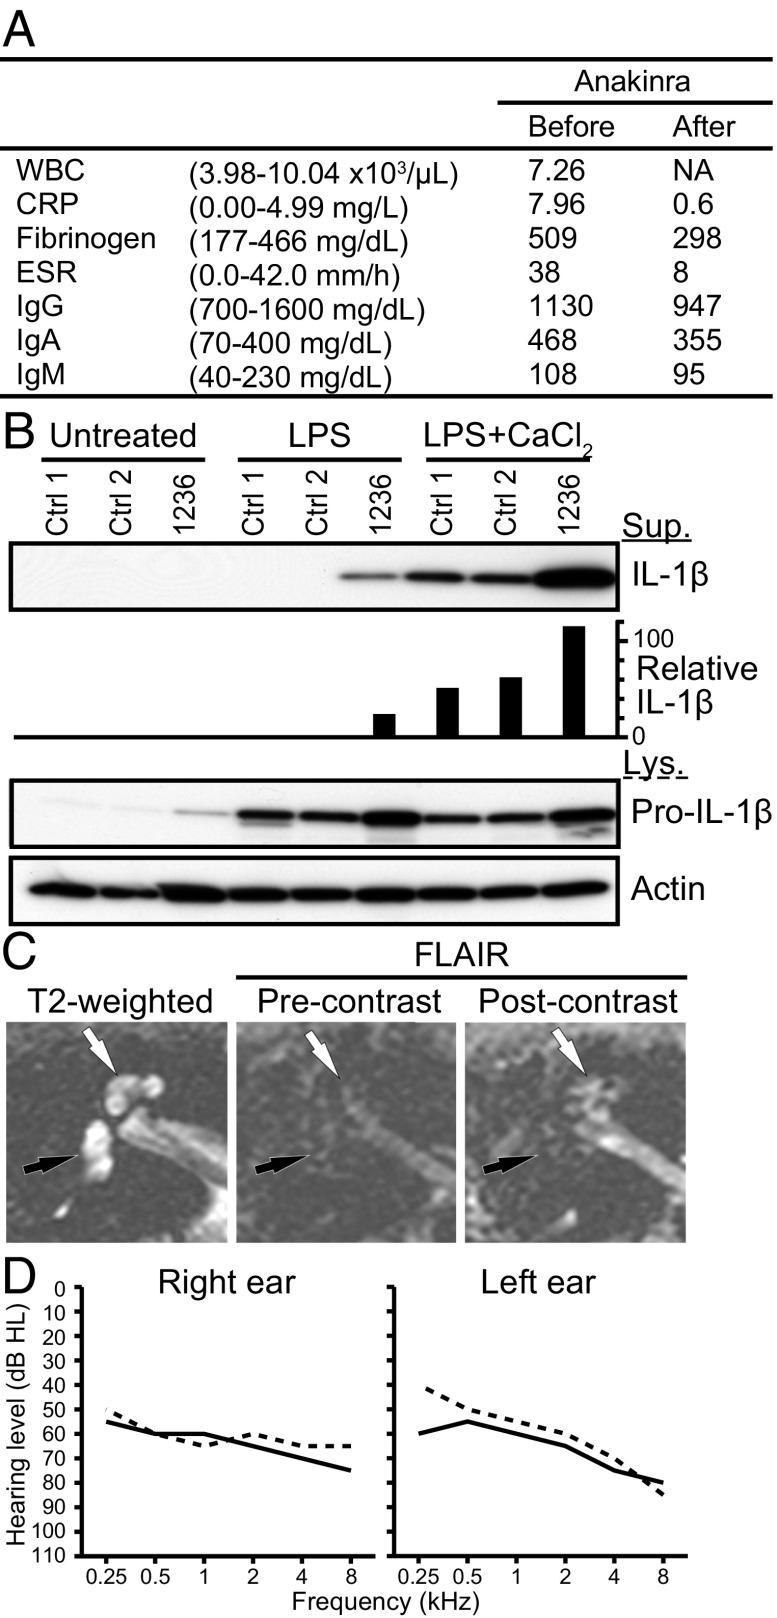
Fig. 3.
Phenotype of subject 1236. (A) Serological test results before and after anakinra administration. The normal range is shown in parentheses. WBC data after the administration was not available (NA). WBC, CRP, ESR, and IgG indicate white blood cell count, C-reactive protein, erythrocyte sedimentation rate, and IgG, respectively. (B) IL-1β was secreted from the patient’s cultured PBMCs in response to LPS, compared with nondetectable levels secreted by normal control (Ctrl) cells. In response to LPS with CaCl2, an increased level of IL-1β was secreted from the patient’s PBMCs compared with those from control PBMCs. IL-1β was measured in the supernatant (Sup), whereas pro–IL-1β and actin was measured in the cell lysate (Lys). Relative IL-1β levels were determined by densitometry analysis of released IL-1β in supernatants, normalized to actin. (C) Magnetic resonance images of the right temporal bone of subject 1236 before anakinra administration. Axial T2-weighted image (Left) shows the normal high signal from fluid throughout the cochlea (white arrow) and vestibule (black arrow). Axial imaging with MRI-FLAIR (Center) without contrast demonstrates the normally suppressed fluid signal from both cochlea and vestibule (arrows). An axial FLAIR image obtained after intravenous contrast (Right) demonstrates high signal in the cochlea (white arrow) but not the vestibule (black arrow), indicating accumulation of contrast from inflammatory changes. (D) Pure-tone air-conduction thresholds before (solid lines) and after (dashed lines) anakinra administration.

