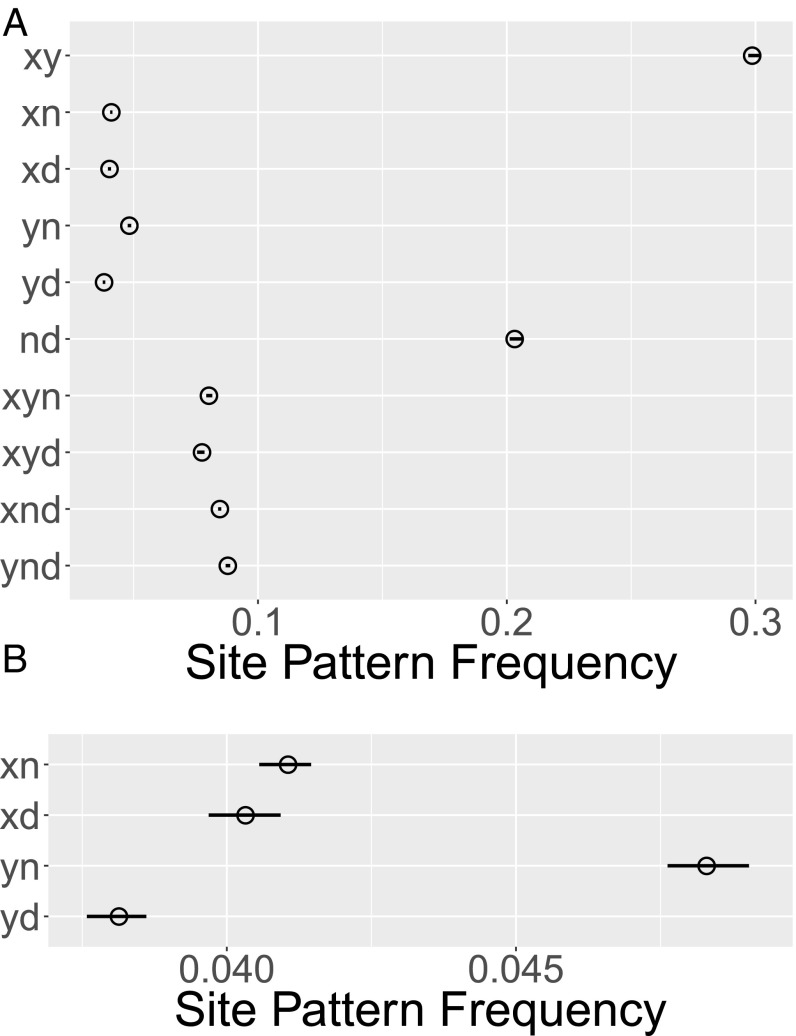
Fig. 2.
(A) Open circles show relative frequencies (horizontal axis) of nucleotide sites exhibiting each site pattern (vertical axis) in four populations: , YRI; , CEU; , Neanderthal; and , Denisovan. (B) Expanded view of four site-pattern frequencies, showing 95% confidence intervals, estimated by moving-blocks bootstrap, with 1,000 polymorphic nucleotide sites per block (13).

