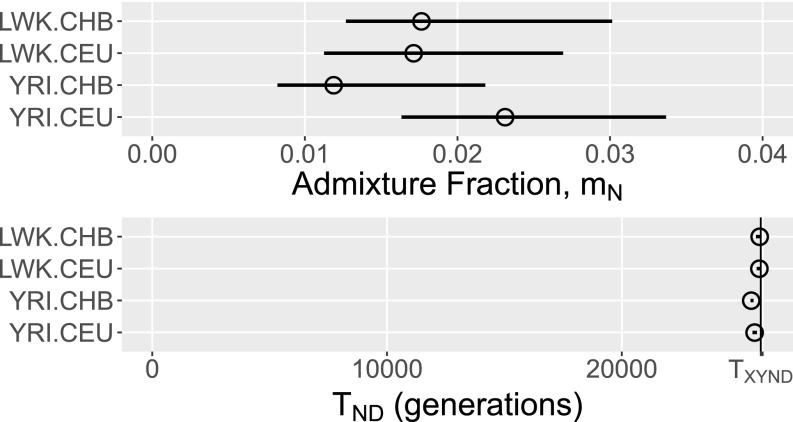
Fig. 4.
Estimates of Neanderthal admixture () and the Neanderthal–Denisovan separation time (). The vertical line (Lower) shows . Horizontal lines show 95% confidence intervals based on 50 moving-blocks bootstrap replicates. All point estimates and confidence intervals are based on stage 2 of the analysis.

