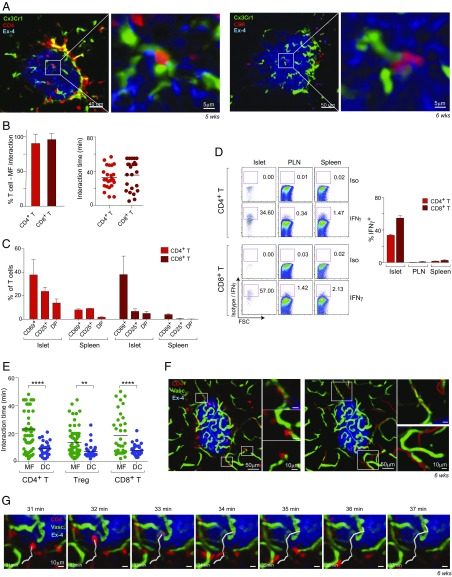
Fig. 3.
Early T cell migration, interaction with APCs, and activation. (A) Representative time-lapse images depicting prolonged contact between T cells with islet resident MFs; white box indicates enlargements. (B) Quantitation of the overall proportion (Left) and duration (Right) of interactions between intraislet CD4+ or CD8+ T cells and islet resident MFs. (C) CD69 and CD25 expression on T cells from isolated islets and spleens of 5-wk-old NOD females; DP indicates frequency of cells expressing both CD69 and CD25. (D) IFN-γ expression in T cells restimulated ex vivo from isolated islets, pancreatic lymph nodes (PLN), or spleen. (E) Quantitation of early T cell interactions with MF and DC outside of the islet. (F) Representative IVM images depicting T cells associated with the vasculature (Left) and randomly selected examples of T cell migration tracks (Right). Boxes indicate regions shown at Right. (G) Representative time-lapse image series of a CD4+ T cell migrating into an islet from the surrounding area. Error bars, SD. **P < 0.005; ****P < 0.0005.

