Fig. 4.
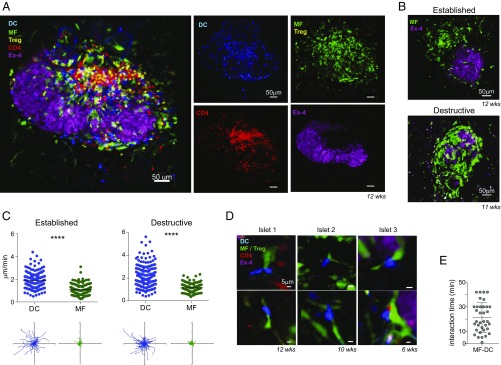
MF and dendritic cell dynamics in advanced insulitic lesions. (A) Representative IVM image of multicellular florid insulitis in a 12-wk-old female Cd4-tdTomato/Foxp3-GFP/Mertk-GFP/Flt3-BFP2 reporter mouse (Left); (Right) individual channels are shown. (B) Representative images illustrating the distribution of MFs in established insulitic lesions (Upper) and destructive lesions (Lower). (C) Quantitation of DC and MF migration velocities and displacement during established and destructive insulitic lesions. Flower plots represent migration over 10 min. (Scale bar, 50 μm.) (D) Images of inflamed islets from three independent mice depicting prolonged interactions between DC and MF. (E) Duration of MF/DC interactions. Data pooled from five mice. Error bars, SD. ***P < 0.0005.

