Fig. 4.
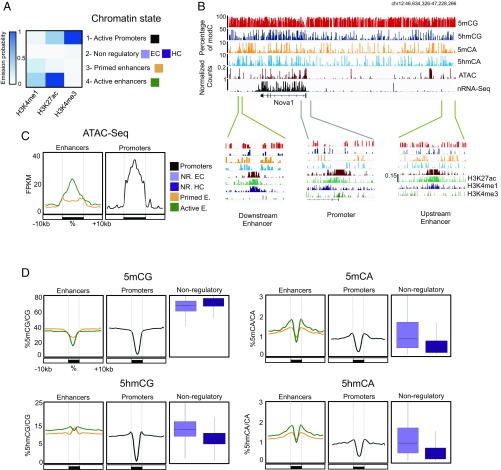
5hmCA is preferentially accumulated in active enhancer shores. (A) Four chromatin states were generated to define combinatorial patterns of H3K4me3, H3K27Ac, and H3K4me1. Color key reflects the frequencies of each chromatin mark in each state, as the emission probabilities of ChromHMM. (B) Browser representation of Nova1 genomic region showing average percentage of 5mCG, 5hmCG, 5mCA, and 5hmCA in 100-bp bins, and H3K4me3, H3K27Ac, and H3K4me1 ChIP-Seq, ATAC-Seq, and nuclear RNA-Seq normalized counts. Two examples of enhancers (46,655,945-46,678,317 and 47,144,638–47,177,401, respectively) and a promoter (46,798,150-46,836,857) are shown in closer detail in lower panels. Maximum values are represented on the top left corner of each track. (C and D) Average ATAC-Seq read coverage (C) and percentage of cytosine modifications (D) within and surrounding promoters and enhancers. In D, distributions of C modifications per each 1 kb from nonregulatory regions are plotted in boxplots.

