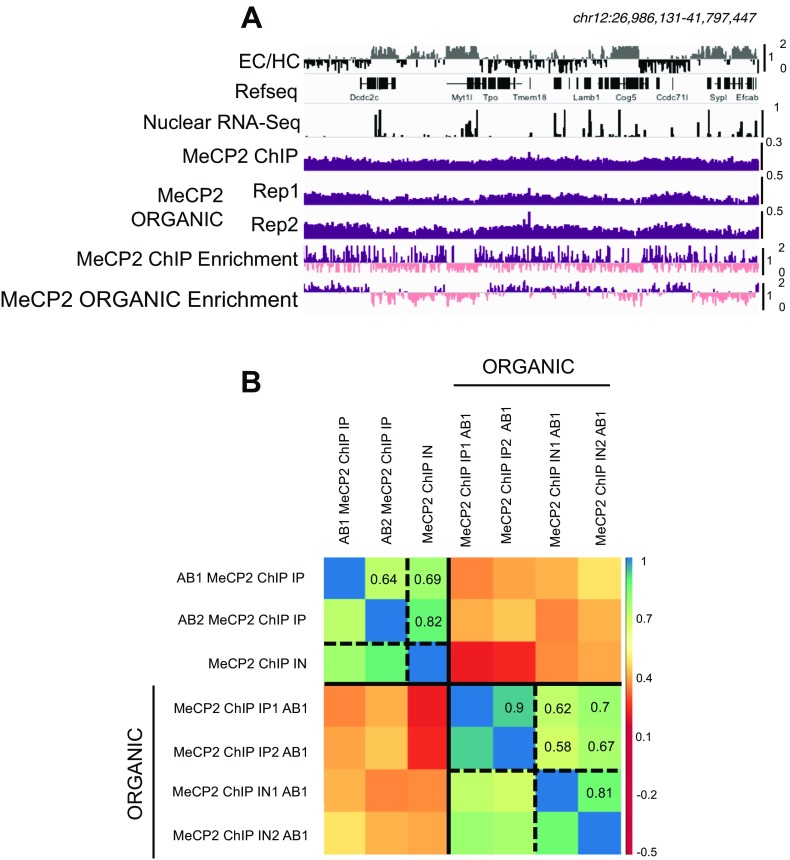
Fig. S3.
ORGANIC MeCP2 ChIP quality control. (A) Browser representation of EC (gray), HC (black), nuclear RNA-Seq, MeCP2 ChIP, and MeCP2 ORGANIC ChIP-Seq counts in two biological replicas and MeCP2 enrichment relative to the input in both MeCP2 ChIP-Seq and ORGANIC MeCP2 ChIP-Seq. Purple and pink distinguish between >1 and ≤1 normalized enrichment. (B) Correlation matrix showing Pearson’s r correlations between two MeCP2 ChIP-Seq using two different antibodies (AB1 and AB2) and input (IN) and two ORGANIC MeCP2 ChIP-Seq (AB1) biological replicas and their inputs. RPKM in 1-Mb windows genome-wide are compared. Samples are ordered by hierarchical clustering.

