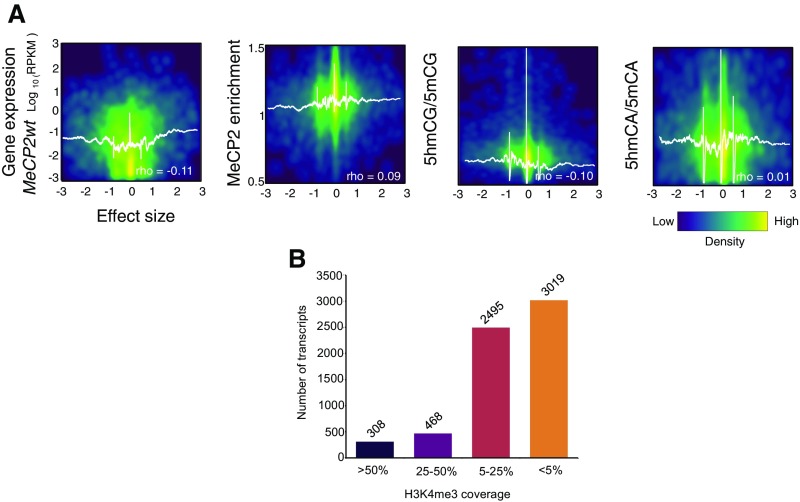
Fig. S4.
MeCP2-dependent gene expression dysregulation affects preferentially euchromatic genes with H3K4me3 low coverage, but not heterochromatic genes. (A) Density plots of HC transcripts showing correlations between the effect size [(MeCP2null − MeCP2wt)/SD pooled] and expression in the WT, MeCP2 enrichment, 5hmCG/5mCG ratio, and 5hmCA/5mCA ratio, respectively. White lines represent moving mean values of y axes grouped according to effect size (200 transcripts bins, one transcript step). Spearman’s rho values are indicated. (B) Number of transcripts on each H3K4me3 category.

