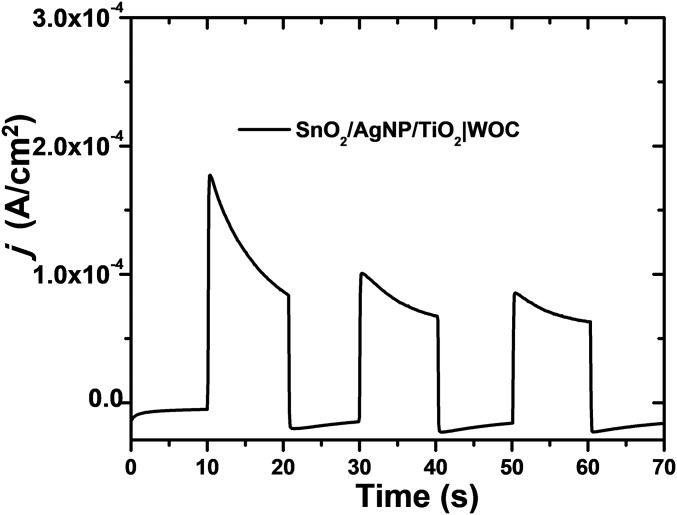
Fig. S5.
Photocurrent density vs. time plot during 10-s dark–light cycles for the chromophore-free assembly FTO|SnO2/AgNP/TiO2|–WOC at an applied bias of 0.2 V vs. Ag/AgCl in 0.1 M HAc/Ac− buffer at pH 4.65 in 0.4 M NaClO4. The illumination intensity was 100 mW cm−2 generated by a white-light source with a 400-nm cutoff filter.

